
A robust monitoring strategy can help you keep local area networks (LANs) running in a streamlined and efficient way. By implementing a LAN monitoring tool, you protect your network from lags, congestion, and downtime. A LAN monitor like SolarWinds® Network Performance Monitor is designed to provide you extra insight into highly complex LAN environments, which is critical to making informed choices for your business.
What Is LAN Monitoring?
What Should I Look for in a LAN Monitor?
Paid or Free Tool?
Best LAN Monitoring Tools List
SolarWinds Network Performance Monitor
Paessler PRTG Network Monitor
SolarWinds Flow Tool Bundle (FREE TOOL)
ManageEngine OpManager
AppNeta
Pandora FMS
Dynatrace
Zenoss
What Is LAN Monitoring?
LAN performance monitoring allows you to view everything connected with your local computer network. This includes routers, printers, servers, computers, and other hardware. With LAN monitoring tools, you’re notified when something goes wrong. For instance, if a printer suddenly goes offline, you’ll receive an alert. Different tools deliver these alerts in different ways, some of which will be more suited to your needs than others.
Moreover, a good LAN monitor will assist you with decisions regarding IT investments, which can be among the most expensive business costs. With a more in-depth understanding of complex LAN environments, you’ll know what’s worth investing in and what isn’t, because you’ll be more familiar with your own business needs and processes.
There are a lot of reasons you might need or benefit from local network control software. For a start, if you don’t use LAN tools, how you spend your time is bound to be less efficient. This is simply because a robust monitor automates and simplifies activities you would otherwise have to execute manually.
Without local network monitoring software, a problem can occur with a network server, router, or switch at any time. If you have a LAN desktop monitor, you can get ahead of these failures and prevent them from occurring or escalating. LAN monitoring is part of a proactive approach, which any successful business will know is critical to continuity and ongoing improvement across all processes and activities. In terms of your network, a proactive approach is crucial to maintaining uptime and keeping important resources online. For most organizations, this can be the difference between success and failure.
With LAN PC monitoring software, another big benefit is your increased level of control over your business’s operating environment. You get insight into details and metrics you wouldn’t otherwise have, which can inform your overall strategy and approach to your IT systems. Acting becomes easier, more automated, and less time-consuming. With most tools, you’ll also get graphical representations of operating environment activity and statistics, often in a unified console.
What Should I Look for in a LAN Monitor?
LAN monitoring tools are extremely varied. They can be simple, like packet sniffing tools, or they can take on full network administration systems. To monitor a network effectively, the tool you’re using should be able to track utilization levels to certify hardware isn’t overloaded. It should also track whether devices are operational or offline, preferably in real time, so you can resolve an issue before it takes a toll on your network’s overall performance.
Since your network is likely to include devices built by a range of manufacturers, it’s important for you to not be bound to a LAN monitoring tool without flexibility of support for vendors. After all, you want your monitoring system to be compatible with all your current network devices; otherwise, you’ll either be leaving certain equipment overlooked or you’ll be forced to replace it with suitable alternatives. This could be a costly route to take. It makes far more sense to ensure your monitoring tool is compatible with your equipment, rather than the other way around.
It is also important to remember the term LAN doesn’t typically incorporate wireless networks into its definition. However, it’s worth considering a LAN monitor that includes your wireless router, as this could save you the need for additional monitoring tools and serves more effectively as an all-in-one solution.
There are numerous tools on the market, each with its own specific offering and unique selling points. The range of LAN system monitoring software, free and paid, can be intimidating, given the range of features and approaches on offer. To help you out, here’s a list of key features to look for when determining which LAN client monitoring tool is best suited to your needs:
- CPU utilization monitoring (specifically of network appliances, servers, and workstations)
- Monitoring for suspicious network activity (e.g., unauthorized access, flood attacks)
- Network switch monitoring
- Router performance monitoring
- Key server file activity checks
- Visibility of user activity
- Monitoring of hard disk space on all devices
- Monitoring of storage space on all devices
Other features will come up in this guide, some with more value than others, but the utilities mentioned above are a good benchmark for a robust LAN data usage monitor. Every organization will have slightly different needs, so you should prioritize the features you think will be most suited to your business processes and activities.
Paid or Free Tool?
In my view, if you’re looking for the best LAN monitor on the market, it isn’t going to be free. With the functionalities some of these paid tools offer, they’re more than worth investing in. Don’t make the mistake of assuming free means better. Back to top
Best LAN Monitoring Tools List
When it comes to how to monitor LAN computers, there’s no clear-cut answer, simply because every program takes a different approach to LAN performance monitoring. In this section, I’ve ranked the best LAN monitors on the market according to their overall functionality, value, user-friendliness, intelligence of design, and capacity for automation.
For each product, I’ve detailed its best features, any relevant drawbacks, and how it monitors LAN computers to deliver excellence and dependability of service. I’ve also considered how efficient the alerts system is, how customizable the product is, how dynamic and easy to interpret the visualizations are, whether the program offers compatibility with multiple vendors, and how versatile the analysis tools are.
In the following product guide, SolarWinds Network Performance Monitor tops my list, because it meets all my requirements for a good program. It’s easy to use, designed in a clever and intuitive way, highly automated, and full of features. 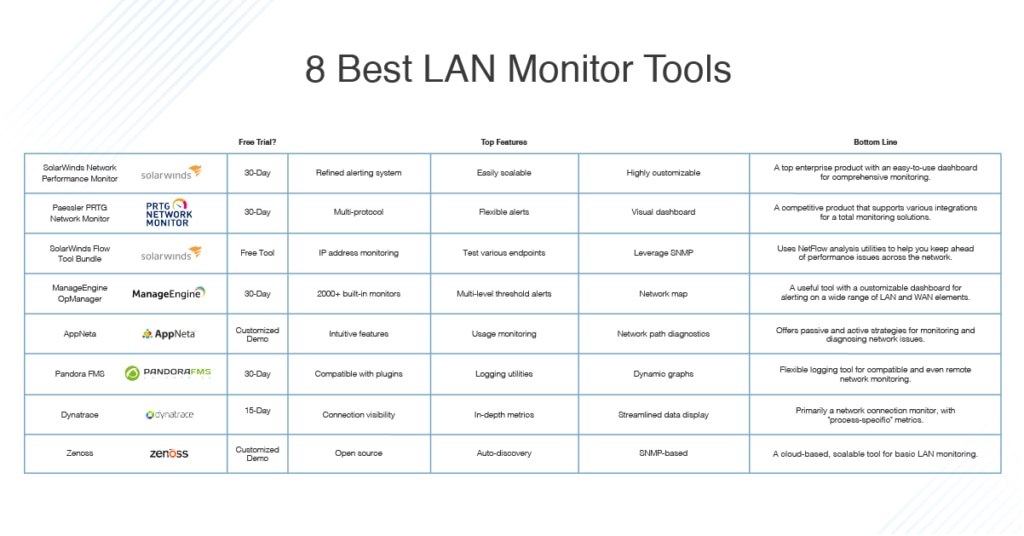
-
SolarWinds Network Performance Monitor (Free Trial)
SolarWinds Network Performance Monitor, also known as NPM, ticks all the boxes. This multi-vendor LAN monitor is super scalable, and its developer, SolarWinds, has a track record for making robust and dependable products to suit all the needs of network administrators.
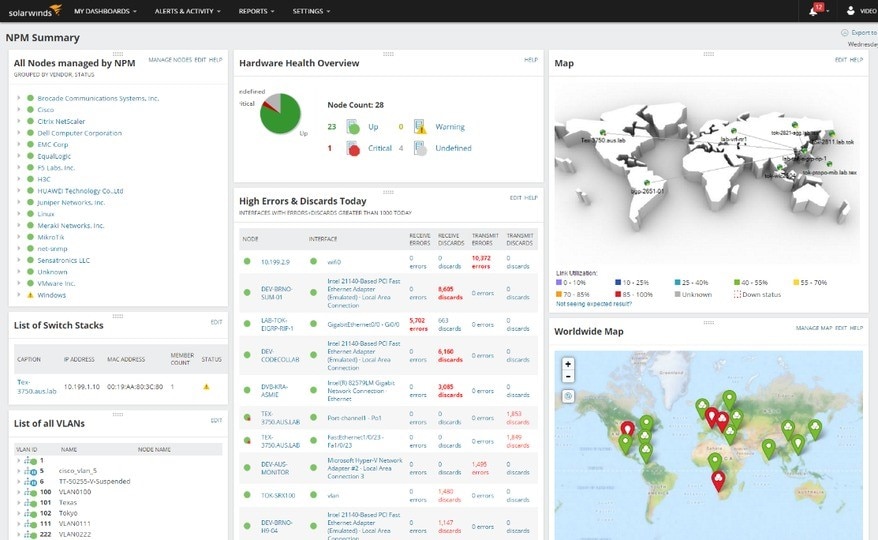
There’s so much to like about SolarWinds NPM. For a start, its dashboard is a winning feature, being both extremely well organized and visually dynamic. The view of your data is nice and clear, with widgets you can move around and prioritize based on your preferences. In the top bar, you’ll find the following tabs: My Dashboards, Alerts and Activity, Reports, and Settings. You can also view summaries, vital statistics, network details, and configuration details, with the option of adding extra tabs, so you can customize your view. Under “Network,” for example, you could choose to have visibility into hardware details, network topology, routing tables, default route changes, current percent utilization of each interface, and hardware health as both a temporary graph and power supply graph, among many other options.
Essentially, this dashboard gives you visibility into all your core IT services and your data center. With the refined alerting system, you’re able to group systems and hardware related to each other. As I briefly mentioned, NPM is scalable, having been designed to function with equal efficiency no matter the size of your network. You can choose to use the out-of-the-box dashboards or customize them to suit your tastes. The out-of-the-box dashboards available means you can get started with minimal setup. You can also customize alerts and reports. I love the line graphs and pie charts in the dashboard, which make data visualization easier and more dynamic. All metrics are, of course, in real time.
The NPM LAN analyzer provides an in-depth LAN monitoring solution, allowing you to conduct LAN mapping on switches, servers, routers, and other WMI- and SNMP-enabled hardware. Another thing I like about NPM is the single-page path analysis, which significantly speeds up the process of isolating network slowdowns.
The reliability of a tool’s alerts system is of utmost importance, and NPM is successful in this regard, with a customizable system where you can establish your own thresholds and conditions. With these alerts, you can gain instant insight into how your network is performing and its overall status. You can even customize the alerts to notify specific people, so you’re alerted on a need-to-know basis. This means you won’t be inundated by a constant flood of alerts. Network alert settings can be tweaked to allow receipt of notifications via text, email, and more.
NPM uses Network Insight™ technology, which adopts an approach based on targeted monitoring. In practice, this means each device’s role within a network will define how it’s monitored. This feature also helps with spotting potential switch, firewall, and load balancer problems.
A huge advantage of NPM is you can use it either as a standalone product or in combination with other SolarWinds products, to create a comprehensive network management solution. This is made possible by the SolarWinds Orion® Platform, on which each of the company’s products are based—in other words, all SolarWinds products are highly compatible. If you want an all-in-one solution without having to pay for utilities you don’t necessarily need, SolarWinds is a great choice, because you can combine whichever programs suit your requirements. Furthermore, with NPM’s remote monitoring capacity, you can use the program across several sites, meaning you can manage and monitor all your hardware from one location—a massive resource-saving feature.
With NPM, you can monitor both wired and wireless networks, with the ability to drill down into the details of each node—for example, you can choose to view device details, current node status, average response time, and packet loss, among many other metrics. You can stay on top of utilization and analyze problems in depth to get to the root cause.
The tab where you can you view node details also uses graphical representations, like pie charts and line graphs, to give you an at-a-glance view of your network’s performance. This includes intelligent Orion Maps, which display physical and logical connections between hardware on an automated basis, helping you make more informed decisions regarding capacity and troubleshooting. These maps update automatically, adding any new connections in real time. NPM mapping tools are intuitive, letting you customize reports with background images, colors, and symbols. SolarWinds offers a fully functioning 30-day free trial of NPM.
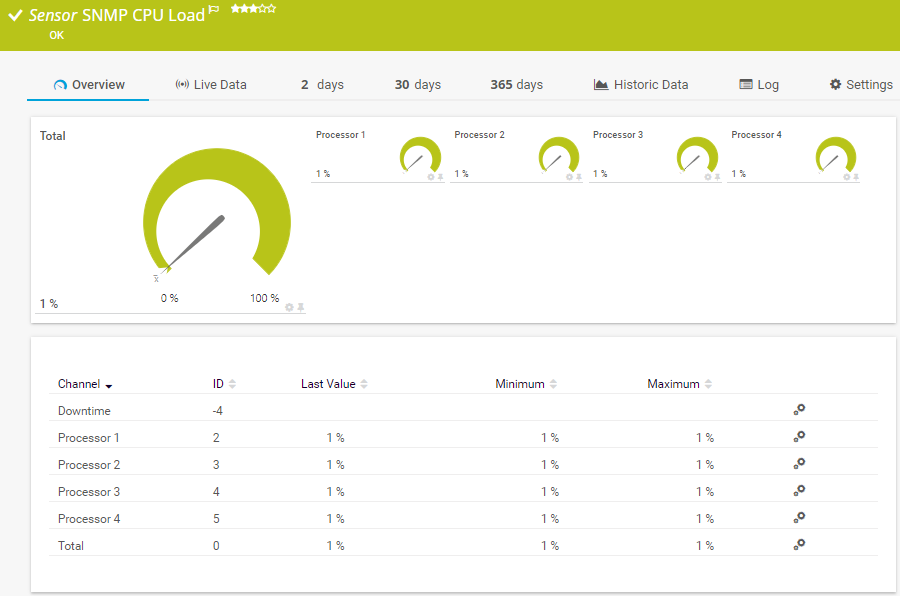
Paessler PRTG is a versatile system covering a comprehensive range of server monitoring utilities, including WAN and LAN monitoring. With this tool, you can stay on top of everything in your local network, including routers, workstations, switches, printers, and servers. PRTG monitors LAN by using a range of protocols, including SNMP, NetFlow, and packet sniffing, among others.
Of these protocols, SNMP is the most commonly used, partly on account of its setup being so simple and how lightweight it is. It requires a minimal amount of CPU and bandwidth and allows single packets of data to be analyzed via packet sniffing. NetFlow technology is used for Cisco device monitoring. You can also access other flow technologies, like J-Flow, sFlow, and IPFIX, by using PRTG’s predefined sensors.
The NetFlow system drives the versatility of PRTG’s monitoring capabilities. It tracks the rates of packet transfers in real time, keeping you informed on a continuous and immediate basis. This lets you drill into the metrics, down to the protocol level, via the sniffer functionality. Beyond NetFlow, PRTG uses SNMP to deliver an alerts system to keep you in the loop, so you can take proactive measures to fix issues before they impact performance. Alerts are delivered directly to you when something goes amiss—whether it be a case of limited availability, problems with the connection, an overworked server, or a range of other problems. Notifications can be sent by either SMS, email, or free push message to an iOS or Android device. Alternatively, you can set up the alerts so you’re sent a syslog message or acoustical notification.
One thing I like about PRTG is how its flexible approach doesn’t lock you into one specific solution, which means you can also use it to monitor distributed networks and wide area networks (WANs). If you want to monitor a distributed network, you can do this from one centralized location, while staying on top of distinct LANs via remote probes. These remote probes collect monitoring data and can be installed either in the same network as your core server or in other networks (provided they have a constant connection to the internet), or both. PRTG also gives you a detailed view of your virtual private network.
WANs, meanwhile, can cross continents and are truly global in some cases. This means they’re far more likely than LANs to experience issues. At the same time, they often host extremely sensitive data and are responsible for running key programs. PRTG’s WAN monitoring solution helps ensure these networks are never offline.
I like the PRTG dashboard, which offers a lot of visual graphic options. This includes pie charts, line graphs, dials, and much more. You can also query specific nodes from within your dashboard, obtaining immediate reports on the status of the node, based on real-time data. There are pages within the dashboard dedicated to individual devices, each with its own array of graphical representations that are super easy to interpret.
A big benefit of PRTG is you can access it from any device on the network. This includes tablets, iPads, and smartphones. The tool supports a vast range of vendors and applications, including Amazon Web Services, IBM, HP, Dell, Cisco, NetApp, VMware, Citrix, SQL Server, Microsoft Exchange, Apache, Windows, and more. It’s available in multiple languages.
The installation process for PRTG is mostly automated, which saves you a lot of setup time, and elements requiring a little manual intervention are supported by Paessler’s comprehensive and easy-to-follow guides. The auto-discovery feature will identify all your devices and create a topology map of your network—I value this feature because it gives you a dynamic and instant view of your whole network.
As a tool to seamlessly unify the monitoring of bandwidth, servers, applications, network devices, virtual environments, remote systems, and IoT, PRTG is a versatile and well-designed program. While its overall user-friendliness could be improved, it’s still a competitive and powerful product.
A free 30-day trial of Paessler PRTG is available. After the trial period comes to an end, the program reverts to the free version, so there’s no risk of an unexpected bill coming your way if you miss the deadline. Alternatively, you can try the free version, which allows up to 100 sensors.
SolarWinds Flow Tool Bundle is a free tool with three network traffic analysis functionalities: NetFlow Configuration, NetFlow Replicator, and NetFlow Generator. For a free LAN monitor, this product is very generous. Each of its analysis utilities brings something distinct to the table, and they come together to form a comprehensive and versatile monitoring solution despite the nonexistent price tag.
Flow Tool Bundle distributes flow data to numerous destinations, tests configurations by simulating network flow data, and configures NetFlow v5 on Cisco devices. NetFlow Replicator is responsible for the distribution of flow data, including the replication of IPv4 and IPv6, to multiple locations. This helps in conducting an analysis of traffic or security. With the Replicator tool, you can configure random samplings of flow data packets, thereby reducing load on the system being monitored and on the collector.
The NetFlow Replicator console is simple and easy to use, featuring spaces to input the IP address or hostname of the listener, the relevant port, the IP address or hostname of the destinations (of which there can be multiple), the ports for each, and the sampling rate of the packets (e.g., 1 in every 2 packets). Once the results come in, you’ll see them under the “Statistics” header. The listener IP address will be accompanied by an “incoming packet rate” field and a “dropped packet rate” field. The destination IP addresses will have an “outgoing packet rate” field, a “dropped packet rate” field, and a “sampling rate” field. You can stop the console at any time. I really appreciate how simple this is.
SolarWinds NetFlow Generator simulates network flow data, allowing you to test and validate all your configurations. This utility is useful, especially when testing more complex network elements, like firewall rules, load balancers, and alert trigger conditions. The Generator console, as with NetFlow Replicator, is easy to use. Under the server header, you can enter information into an “IP address or hostname” field and a “port” field. You can then tick or untick “node simulation.” If left unticked, the next section will be “SNMP interfaces,” where you can input the number of interfaces, average flows per second of traffic, and flow settings (flow type, sampling rate, NBAR2). If you tick “node simulation,” beneath it you’ll have the option to tick either “single or CIDR” or “range.” If you choose “single or CIDR,” there will be a space to enter the IP address or CIDR notation. You can then add endpoints.
NetFlow Configurator configures and activates NetFlow v5 on Cisco hardware (provided it’s supported), entirely remotely. The Configurator lets you establish a router, from which you can send NetFlow records to the collector. This utility first asks you to input device information and credentials, including IP address or hostname; choose the SNMP version (v1, v2, or v3); and establish the community string (i.e., “private” or “public”). The next stage asks for destination details, including IP address or hostname and port. It also includes a list of interfaces, allowing you to tick “ingress” or “egress,” or both, for each of them. You can then apply these conditions, and a summary is generated.
For a free tool, SolarWinds Flow Tool Bundle is excellent for helping you get ahead of a problem before it affects performance. There is, however, plenty it can’t do. It cannot detect network performance issues, diagnose them, or resolve them. It cannot track availability, response time, or uptime of switches, routers, and other SNMP-enabled hardware. It can’t analyze network bandwidth performance or patterns of traffic, and it can’t optimize your CBQoS policies. You won’t get to view your data in the form of graphs, and the overall functionality is minimal compared to most of the paid tools. If these features are important to you, consider SolarWinds NPM instead.
You can download SolarWinds Flow Tool Bundle here.
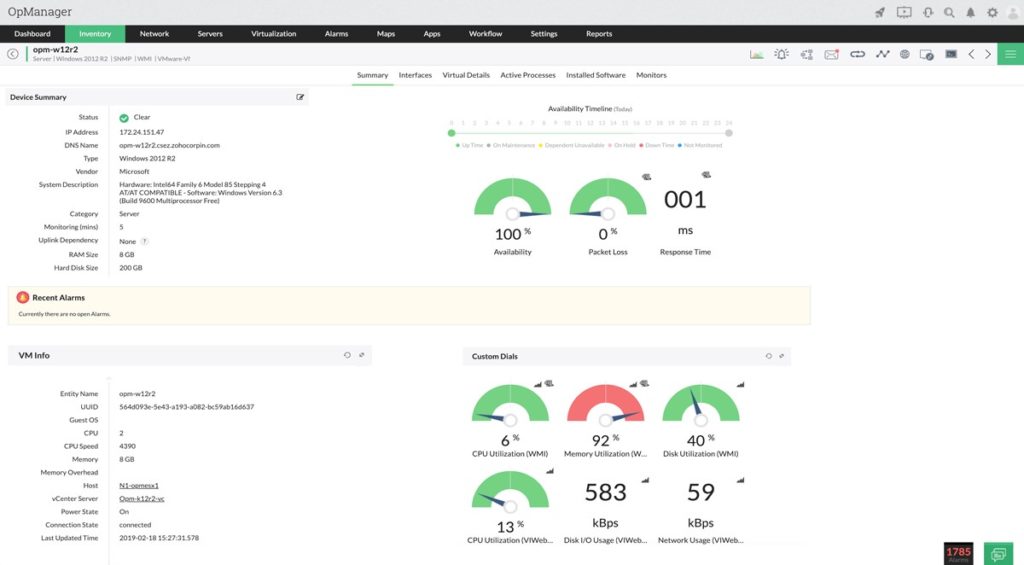
ManageEngine is a big-name competitor in the field of network software development, and OpManager is one of its most popular products. OpManager is not just a LAN monitor. It monitors routers, switches, load balancers, firewalls, wireless LAN controllers, virtual machines (VMs), servers, storage devices, printers, and more. This tool also offers both physical and virtual monitoring of Windows and Linux servers, and the performance of VMs and host computers powered by VMware, Hyper-V, and Xen platforms. Essentially, anything and everything with an IP and connected to the network can be monitored.
To undertake this monitoring, OpManager uses more than 2,000 built-in monitors for network performance, covering pretty much everything you could imagine. This includes packet loss, speed, latency, discards, CPU, memory, WAN performance, errors, and bottlenecks. All these elements are monitored in real time, so you’re always up-to-date. With WAN link monitoring, you can stay on top of key metrics like jitter, RTT, and packet loss, even viewing hop-by-hop performance to more quickly identify the root cause of latency.
I also appreciate the OpManager alerts system, which allows you to establish multi-level thresholds. If there’s ever a violation, you receive an alert. These thresholds can be associated with a single device or applied across multiple devices. Notifications are delivered by SMS, email, or both, but you can also configure OpManager to run external programs or homemade scripts automatically when an alert is triggered.
The tool’s dashboards are also worth mentioning. OpManager lets you customize your dashboard with over 200 performance widgets, which can be arranged according to your taste and priorities. This gives you a rapid, at-a-glance perspective on your network. Alternatively, you can use OpManager’s default dashboards.
The console features a map of your network, giving you a constant overview of its status. This is informed by the auto-discovery utility, which finds all the devices on your network. Besides maps, other graphical representations are available, including charts and dials. Each of the graphs is color-coded, making it easy to interpret. For further detail, just click on the graph and it will expand in size to give you a better view.
OpManager is primarily a paid tool, but it does offer a free version to monitor up to 10 devices. This isn’t suited to business use or to those of you with average-sized or large networks to monitor. However, if you want to get a taste for OpManager without downloading the free trial, you might give the free version a shot.
There are two OpManager plans available besides the free one: Professional and Enterprise. With the Professional version, you can manage up to 1,000 nodes. With Enterprise, you can manage up to 10,000 nodes. Both options can also monitor WAN and voice systems, using QoS utilities and remote monitoring functionalities to do so.
OpManager features an application for Android and iOS mobile devices, so you can stay in the loop even when you’re on the go. If you want to try the Professional or Enterprise versions of OpManager, a free trial of each is available.
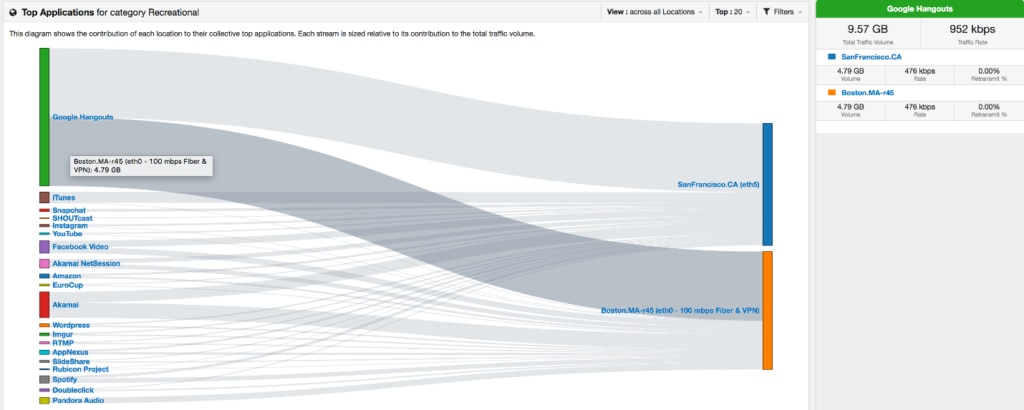 AppNeta takes a four-dimensional approach to monitoring by combining active and passive strategies for collecting data, to create an actionable understanding of your network. This versatile tool gives you visibility into your WAN applications, whether they’re internal apps or third-party SaaS solutions. AppNeta provides insight into private cloud deployments, public cloud infrastructure, and remote sites. It covers VoIP/UC, WAN, LAN, Wi-Fi, and DNS monitoring and boasts a range of intuitively designed features.
The LAN monitoring utilities offered by AppNeta combine delivery path monitoring with application identification and the analysis of traffic. The tool proactively identifies congestion issues and high retransmit rates to give you a clear overview of how network performance might be degrading. This proactive approach means if an issue arises, a deep network path diagnostics process is initiated, and an SNMP device poll is triggered.
The results of this process will give you a detailed and comprehensive understanding of the problem, so you can identify and treat the root cause. This is fundamental to any network monitoring tool’s success, because issues become pervasive and continuous when the symptom is treated without the source of the problem being addressed. To achieve a truly healthy network, you need a tool to provide as much detail as possible, with the aim of rooting out the origin of a problem.
Application identification is a key part of AppNeta’s approach to monitoring. Usage monitoring identifies, classifies, and categorizes traffic so you’re aware of which applications are bandwidth hogs and which applications are lagging prior to an influx of user tickets. With this program, you can monitor retransmit rate, throughput, latency of the network, and latency of applications for each host and user. You can monitor over time and across multiple locations, which affords you an overview of your network’s long-term performance.
While this tool certainly has a lot to offer, the dashboard could be improved. It’s not particularly user-friendly or dynamic, and the data can be tricky to interpret. You can request a customized trial version of AppNeta.
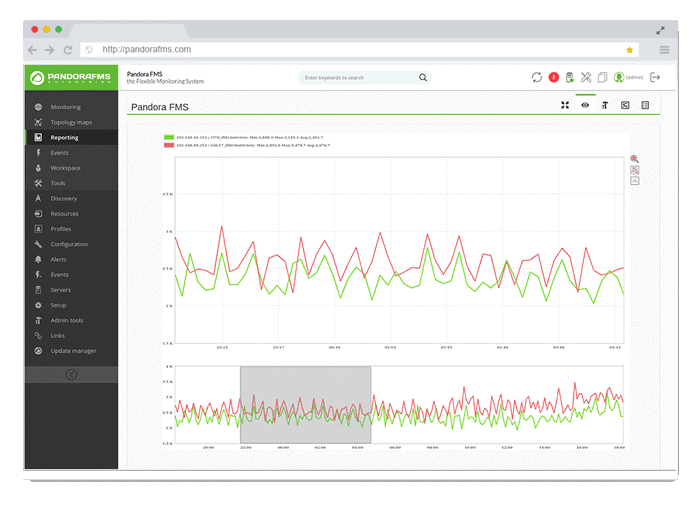 Pandora FMS is a flexible LAN monitor that gives you complete control over every device type in your network, regardless of the model or the size. The tool covers a wide range of utilities. You can plan server capacity and monitor everything from hardware to operating system, with access to multiple preconfigured plugins to give you visibility into performance metrics in a streamlined way. The plugin approach means Pandora FMS is what you make of it, which for many businesses is an advantage.
The tool offers logging utilities, obtaining OS and app logs directly from your monitoring agents. It’s cloud compatible, which means it can unify the monitoring solution, incorporating all your distributed environments into a centralized system. It also provides you with specific metrics via the Pandora SAP-certified plugin for S/4, R/3, and SAP Hana DB. It even offers IoT monitoring functionalities.
In terms of LAN and network monitoring, Pandora FMS serves as an all-in-one solution. One of my favorite things about it is the way it displays data. The graphs are dynamic and varied, giving you flexibility in terms of how you view your network. There are line graphs, scatter charts, topology maps, and more, all of which can show data up to three years old, so you have a clear understanding of how your network has changed.
Another benefit of this program is it allows for remote monitoring. With Pandora’s satellite servers, everything is managed centrally, but networks can be monitored without external access. Pandora FMS comes with a remote software and license inventory to support this.
This tool is available for Windows, Linux, and Unix devices, whether they have agents. It has an integrated MIB Explorer with custom MIB loading, an auto-discovery utility for networks at level 2 or 3, the capacity to launch thousands of checks per second by utilizing decentralized probes, and self-configuring thresholds that learn from the network. Overall, this is a great product, packed full of features. The drawback, in my view, is its commitment to doing everything dilutes the quality somewhat. I
f you think Pandora FMS might be the right LAN monitor for you, check out the free trial of the Enterprise version.
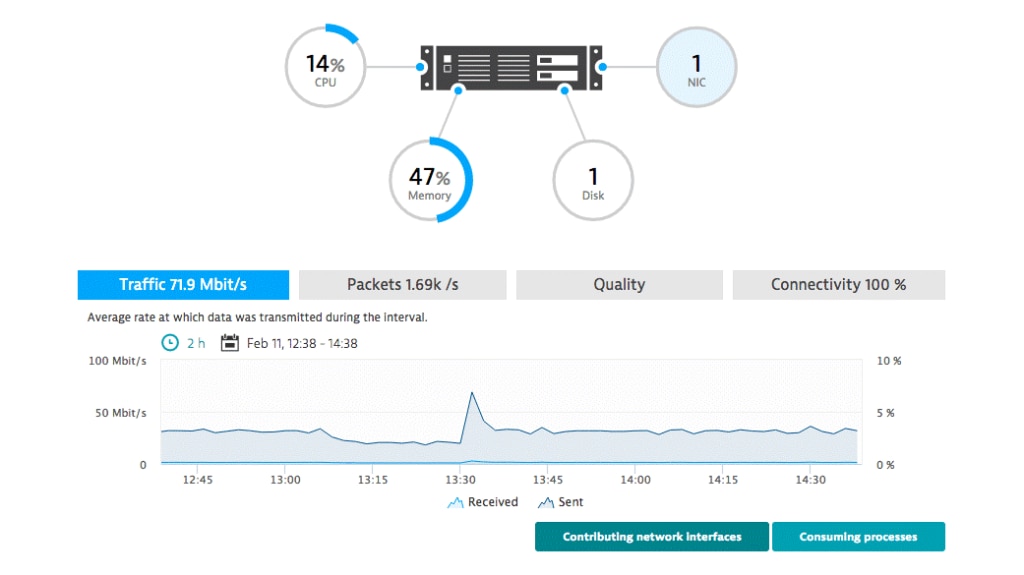
Dynatrace takes a slightly different approach than most other network monitoring solutions. As a network connection monitor, its main purpose is to address network connection performance, rather than device status.
Dynatrace calls itself “process-specific,” and it focuses on monitoring metrics like retransmissions and requests. It gives you in-depth metrics regarding process-to-process communications, including processes distributed across data centers and virtualized cloud environments. This proactive approach gives you greater awareness of which of your processes and services have connection problems, so your team can address the issue in question quickly, before it affects overall performance.
Dynatrace offers you a transparent and detailed view of all your inbound and outbound process connections, across both virtual and physical interfaces. With this tool, you can stay on top of the status of ESXi hosts, VMs, and cloud instances.
I particularly like the way data is displayed with Dynatrace. The graphs are engaging, clear, and color coordinated, making the whole console aesthetically appealing and streamlined. I also appreciate how detailed and intelligent the metrics are—giving you visibility, for example, into how much bandwidth is being consumed by processes. This process-level monitoring approach can help with capacity planning by making it easy to identify resource-intensive processes. All monitoring is done in real time and extends to virtual environments, with the tool discovering and mapping connections in the same way it does with physical network monitoring. You’ll gain a better understanding of how much traffic each virtual machine gets, which will further contribute to capacity planning.
Dynatrace is a program with useful automated utilities, including the automatic discovery of new machines and network interfaces as they enter your infrastructure. These are added and monitored without you having to manually set them up. You can access a 15-day free trial of Dynatrace.
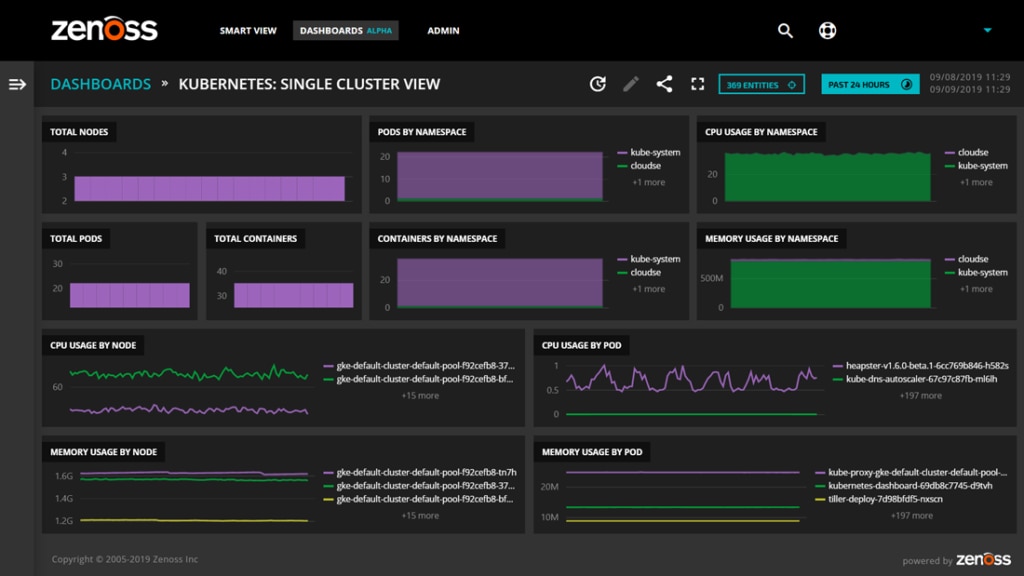
This versatile open-source program is available as a free version and two paid versions. The free version is called Zenoss Community Edition. In terms of its paid offerings, you can choose between an on-premises service, called Zenoss Service Dynamics, and a managed cloud-based service, known simply as Zenoss Cloud. All service options feature an auto-discovery utility, which identifies and maps all your network devices. If you go for the free version of Zenoss, you can monitor up to 1,000 devices, which is surprisingly generous. If you choose one of the paid versions, you can monitor as many devices as you want, with no limit.
This system is SNMP-based, which means you get instant compatibility with any new hardware manufactured with a network connector. It also supports SNMP alerts, which notify you of device failures. These notifications go straight to the dashboard.
With Zenoss, scope seems to be the name of the game. The tool monitors standard network hardware, like terminals and printers, but also extends its monitoring capacities to less standard network equipment. This includes power supplies, ports, fans, server racks, and fabric cards.
Having the option of a cloud-based service is another key benefit of Zenoss. Because the system is serverless, this makes scaling far easier. So, if you’re expecting a lot of growth, Zenoss Cloud might be the tool for you.
You can request a customized demo of Zenoss Cloud or download the Community Edition for free.
How to Choose a LAN Monitor
If you’re in the market for a LAN monitor, you may find yourself overwhelmed by the sheer number of options (I know I was), all offering different combinations of features and approaches. I developed this guide to help you sift through the available products and find the one best suited to your needs. For small businesses with low monitoring needs, you might find a free tool will work just fine. However, for larger companies or those looking to scale, you’ll want a more robust, comprehensive solution.
There are a lot of good options out there, but none of them can beat SolarWinds Network Performance Monitor. NPM combines usability, functionality, and intelligent design to create a scalable solution and offer great return on investment. It’s the most sophisticated LAN monitor available, without sacrificing on dynamic, attractive dashboards and all-around user-friendliness.