When you’re managing a large network, it can be hard to keep on top of the many various components. When something stops working, troubleshooting needs to be done as quickly as possible before the problem affects your end users—and with a complex network, the troubleshooting process can take a while. The last thing you want is a long line of people or a string of emails complaining about how the network isn’t working.
Following network monitoring best practices is vital for maintaining a healthy and high-performing network, so users consistently experience good uptime and quality of service. Using a network monitoring tool or software can take a lot of the stress out of this process, and with automatic monitoring, you can fix problems before they reach your end users. I recommend SolarWinds® Network Performance Monitor, as it integrates well with my other systems, and helps me to efficiently resolve issues.
Best Practices for Network Monitoring
Your network is one of the most valuable parts of your company: without it, your systems don’t run, you have no data stored, your employees can’t work, and your users can’t use your product!
A lot goes into network maintenance, including configuration management, fault management, performance, security, and account management. To manage these important processes properly, you need to ensure you’re monitoring your network appropriately and maintaining its health.
Below are what I consider to be the basics of good network monitoring, from both my own experiences and the common practices of enterprises around the world.
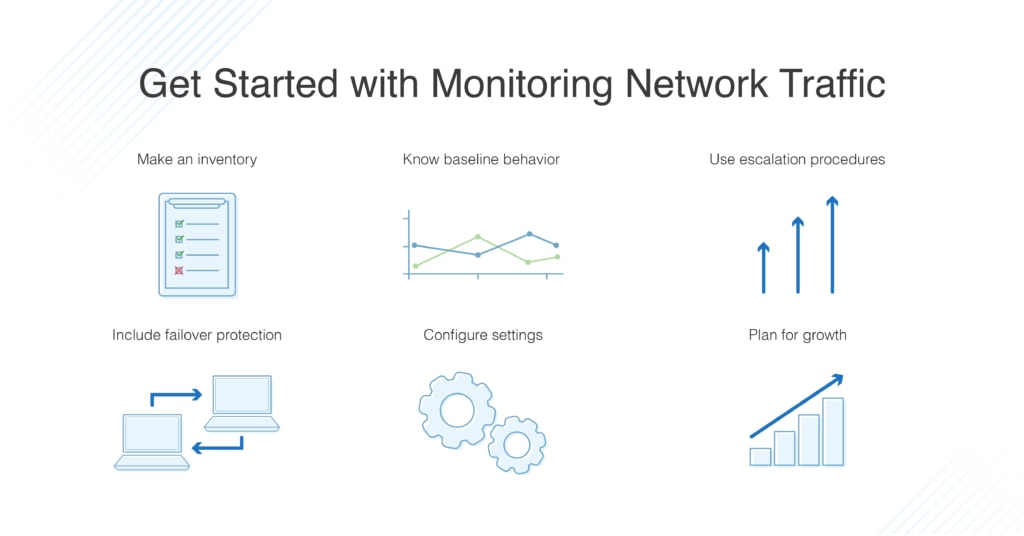
- Make an inventory. First, make sure you have a clear and up-to-date inventory of the devices in your network. It becomes harder to do this manually as your network grows rapidly and becomes more complex. A network mapping and monitoring tool can perform inventory functions for you.
- Set baseline behavior. A network baseline is simply a set of expectations and measurements applicable when the network is behaving normally. The primary purpose of determining baselines is so you can detect any issues that might arise if there is a problem with the network, including application behavior, device glitches, or malicious behavior. Without a clear baseline, it’s hard to identify network behavior as unusual.
Be sure to collect data constantly with a decent amount of detail, so you can keep on top of the resources and traffic on your network. Without this information, you won’t know if something is broken. You also need this network baseline data to set effective and meaningful alerts to indicate when a problem has occurred. - Implement escalation procedures. One of the possible issues with network monitoring practices concerns not the process itself, but the people involved. Make sure you have appropriate escalation procedures in place, such that if an issue becomes increasingly problematic, it can be escalated to someone equipped to deal with it. A clear and well-practiced escalation matrix helps ensure a small problem doesn’t become a major issue or affect your users.
Your coworkers will also want to know who to talk to for particular problems, and having a clear structure of authority is important in this regard. Office staff should know who to approach without having to go through two or three different people. - Protect availability and include failover protection. The network is going down or performing extremely slowly is one of the worst things that can happen. It can massively affect users, whether this is clients or staff within your organization. High availability and failover measures are vital for troubleshooting issues in your network even when a major part of it has gone down. Make sure you don’t have a single point of failure for your network, and if you’re using a monitoring system (which I highly recommend for all sysadmins), be sure it’s installed on a separate part of your network so it can continue to function.
Always plan ahead for updates and network changes and keep on top of device lifecycles so you’ll know when something is reaching the end of its life. If a device fails at a critical time, you could end up with lost data or major service failure. - Set up and configure correctly. Many network issues arise from the network not being set up properly in the first place. By configuring your network appropriately from the beginning, you can avoid issues further down the line. You can also use monitoring software to implement network configuration management, so when you change or reconfigure something in your network, it doesn’t break something else. Configuration management is a preventive measure to end problems before they have a chance to occur.
Use graphical reports to understand the activity and topology of your network. It can be hard to visualize exactly how something is set up until you see a picture of it. A lot of tools are available to map your network for you, or use bar graphs or charts to show you how something is performing or where there are health issues. You should also make sure you have robust security systems implemented, and all security devices are running as expected. - Plan for growth. Finally, plan for your network to expand. By building in features to allow your network to grow and change with your business, you can cut down on network changes and disruptions that reduce service quality.
How to Monitor Network Traffic
Building on these best practices, it’s time to look at the basic components of network monitoring. It’s important to track and manage not only traffic on your network but performance, as each affects the other. There are a number of key network components you should make sure you are always monitoring.
- Device availability – Keep tabs on all network device availability, particularly the critical servers on your network. If an important network device such as a central server goes down, it can take down your entire network (or a significant part of it) along with it.
- Storage – Keep an eye on the storage capacity and disk space on all your critical servers. If your storage systems are getting too full, this can cause slowdowns and problems for your end users. In addition, if you have a good idea of what your storage systems should look like, you’ll be better able to detect anomalous behavior.
- Security – Make sure your firewalls, antivirus and malware protection, and update servers are functioning. There’s no point having these tools installed if they aren’t working.
- Traffic – Monitor all traffic coming in and out of the network. This will help you to establish clear baselines and identify peak periods in advance, so you can undertake appropriate capacity planning to mitigate times when large amounts of traffic are coming through.
Optimizing Performance with Sysadmin Monitoring Tools
When any of these components have a problem, an immediate update is extremely important, as any delays when it comes to security or performance issues can massively affect your system. This is where sysadmin monitoring tools become crucial. When an issue arises, a good network traffic monitor will automatically and immediately alert you, supplying all the information you need to follow through and keep your network functioning.
My top choice for a network monitor is SolarWinds Network Performance Monitor (NPM), a high-quality tool with a range of features to simplify and optimize the network monitoring process.
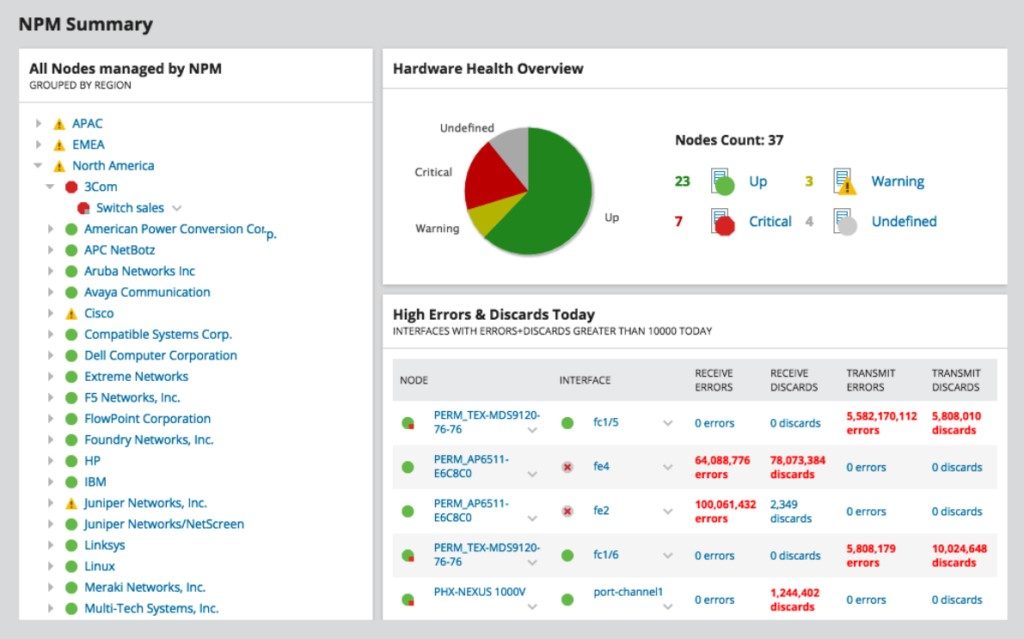
While SolarWinds NPM is used by IT professionals, it’s designed to be simple and intuitive to use regardless of skill level. It sets clear network baselines, giving you a way to determine unusual network behavior, and it includes robust alerting tools that can be tailored to fit various trigger conditions, so by the time you receive complaints or questions from clients or office staff, you can let them know you’re already handling it.
You can map your network and gain an overview of the network topology using the NetPath™ function of NPM, which also provides you with hop-by-hop network performance data so you can pinpoint exactly where in your network an issue is occurring. The PerfStack™ data correlation feature also displays different performance metrics in graphs alongside one other, letting you see how one metric is possibly affecting another, and the repercussions this has for network performance.
Network monitoring does not have to be daunting or complex if you take the time to set up your configuration correctly at the start and use a good tool that fits in with the best practices outlined above.
Recommended Reading
Ultimate Guide to Network Monitoring: If you want to learn more about network monitoring in general, I’ve also written this guide, which is a bit more comprehensive. Take a look!