
For enterprises around the globe, the ability to access the internet and harness network resources has evolved from a convenience to an absolute necessity. Connectivity keeps us informed, allows us to make decisions, turns ideas into tangible products and services, and keeps the world moving forward.
Yet, as modern networks have grown in complexity, they have also become more susceptible to an array of challenges capable of disrupting services and causing considerable setbacks. The solution? Network monitoring. From analyzing metrics to establishing security measures, network monitoring keeps businesses connected so that smart environments and operational landscapes can continue to run smoothly and safely.
Why is Network Monitoring Important and What Are Its Key Benefits?
How Does Network Monitoring Work?
What Are Some Challenges Involved With Network Monitoring?
Network Optimization Techniques
How Do Network Monitoring Alerts Work?
Best Practices for Network Monitoring
How to Troubleshoot Network Issues
How to Choose a Network Monitoring Solution
Five Best Network Monitoring Tools
1. SolarWinds Observability Self-Hosted – Free Trial
2. SolarWinds Network Performance Monitor (NPM) – Free Trial
Monitor Your Network for Long-Term Success
In this guide, we will delve into the very essence of network monitoring—from what network monitoring is and what it consists of, optimization techniques, and software programs capable of automating repetitive and complex tasks. Here’s everything you need to know about network monitoring in our interconnected modern world.
What is Network Monitoring?
Network monitoring is the ongoing practice of overseeing a network’s performance, health, and security to ensure it runs smoothly and safely. It involves continuously collecting and analyzing data from various network components and devices to quickly identify issues, troubleshoot problems, and optimize network efficiency.
Network monitoring helps administrators keep a vigilant watch over a network’s vital signs by tracking metrics such as bandwidth usage, data delivery, and server response times. When deviations from normal behavior occur, a network monitoring solution will promptly alert admins, allowing them to address issues in real-time.
Beyond troubleshooting, network monitoring also aids in improving network performance. By analyzing historical data and trends, admins can make informed decisions about resource allocation, capacity planning, and overall optimization, thereby preventing network congestion and downtime.
Why is Network Monitoring Important and What Are Its Key Benefits?
First, it keeps operations running smoothly. Any downtime, whether caused by hardware issues or errors in setup, can lead to financial losses and damage an organization’s reputation. Network monitoring software constantly checks the health and performance of a network, spotting and fixing problems before they can disrupt operations.
Network monitoring also provides real-time data on how a network is performing, giving organizations the insights needed to make it work better. Whether it’s identifying where a network has too much traffic or where things are slowing down, network monitoring gives you the tools to pinpoint and fix these issues. This means data flows more efficiently, and users can enjoy a smoother experience, which is vital in a world where people expect fast and reliable connections.
Another reason why network monitoring is important? It acts as an early warning system, quickly spotting any suspicious activity, intrusions, or potential malware attacks. This early alert system allows companies to respond swiftly, minimizing risks, isolating compromised areas, and strengthening security measures.
Besides keeping businesses running and thwarting potential threats, network monitoring also provides organizations with a number of benefits, including:
- Reliable Network Availability: Downtime can be costly for businesses, but network monitoring helps detect and resolve issues before they lead to downtime, which minimizes disruptions.
- Resource Optimization: Monitoring helps organizations allocate resources efficiently. By analyzing usage patterns, admins can make informed decisions about bandwidth allocation, hardware upgrades, and software optimizations.
- Cost Reduction: Identifying and addressing network inefficiencies can lead to cost savings. By optimizing resource usage and preventing downtime, organizations can reduce operational expenses.
How Does Network Monitoring Work?
In general, network monitoring works by continuously collecting data from various network devices and components and analyzing it to assess performance, health, and security. Here’s a deeper dive into the ins and outs of network monitoring.
Data Collection
Network monitoring tools gather data from routers, switches, firewalls, servers, and other network components. This data includes information about bandwidth usage, packet loss, latency, CPU and memory utilization, and more.
Data Storage
The collected data is then stored in a database for historical analysis. This historical data enables network administrators to identify trends over time, make informed comparisons, and generate detailed reports. Access to this historical data allows organizations to not only address current issues but also make data-driven decisions for the future.
Data Analysis
Network monitoring tools continuously scrutinize the collected data, comparing current metrics with predefined thresholds and baselines. When deviations from these thresholds occur, the system is triggered, promptly raising alerts. This proactive analysis ensures that potential issues are spotted and addressed before they escalate into larger problems.
Alerting
When a problem or anomaly is detected during the data analysis phase, the monitoring system generates alerts. These alerts can be configured to reach administrators through various communication channels, such as email, SMS, or other messaging platforms.
Visualization and Reporting
Network monitoring tools often provide user-friendly graphical interfaces and reporting features. These visuals offer administrators an intuitive way to gain insights into network performance and health at a glance. Whether it’s through charts, graphs, or dashboards, visualization makes it easier to identify patterns, spot anomalies, and understand the overall network picture.
Action and Remediation
After receiving alerts or analyzing reports, administrators take action to address issues. This phase involves making necessary adjustments, such as reconfiguring devices, reallocating resources to alleviate bottlenecks, or implementing security measures to address detected vulnerabilities. This swift action is critical for maintaining network efficiency, ensuring security, and delivering a seamless user experience.
Network Performance Metrics
To effectively monitor a network, you need to track various performance metrics, the most important ones being:
- Bandwidth Usage: Measures the amount of data transmitted over the network. High bandwidth usage can lead to congestion and slowdowns.
- Latency: Indicates the time it takes for data to travel from the source to the destination. High latency can result in delays in data transmission.
- Packet Loss: Measures the percentage of data packets that are lost during transmission. Excessive packet loss can impact the quality of communication.
- Network Traffic: Analyzes the volume and patterns of data traffic. Monitoring traffic helps identify anomalies and potential security threats.
- Error Rates: Tracks the number of errors in data transmission. High error rates can indicate issues with network components.
- CPU and Memory Utilization: Monitors the resource usage of network devices and servers. High utilization can lead to performance bottlenecks.
- Availability: Measures the percentage of time the network is operational. Network availability is critical for uninterrupted services.
- Jitter: Evaluates variations in packet arrival times, which can affect the consistency and quality of real-time data streams, such as voice and video communications.
Types of Network Monitoring
Not all networks are made equal, which means organizations may need several types of network monitoring to ensure comprehensive oversight and protection over their network. The following are key monitoring types to consider.
Availability Monitoring
Availability monitoring primarily focuses on ensuring that network devices and services remain accessible and responsive. It involves continuous checks to determine whether critical network components are online and functioning correctly. Key aspects of availability monitoring include tracking device uptime, verifying service availability, and measuring response times.
Performance Monitoring
Performance monitoring involves tracking various network performance metrics to optimize overall network efficiency and user experience. Here, continuous data collection and analysis is used to identify bottlenecks and areas for improvement. Admins may look at bandwidth usage, latency, packet loss, and resource utilization to gauge the health and function of their network.
Security Monitoring
This type of monitoring centers on continuous surveillance of network traffic and activities to detect suspicious behavior and potential breaches. Software tools in this realm may include capabilities such as intrusion detection, malware analysis, and log and event monitoring to help organizations remain proactive against potential threats.
Traffic Analysis
Traffic analysis dives into the patterns of data moving through the network, helping administrators understand how resources are used and spot unusual activities. This form of monitoring enables admins to study traffic, identify which applications are in use, and detect minor anomalies before they snowball into larger issues.
Application Monitoring
Application monitoring focuses on the performance and availability of critical applications to ensure they work smoothly and meet user needs. For admins, this means measuring how quickly applications respond, tracking specific actions, and catching bugs and errors.
End-User Experience Monitoring
End-user experience monitoring gauges how individuals perceive network performance, gathering user satisfaction feedback, and measuring response times from the user’s viewpoint. With this feedback, admins are able to prioritize improvements that will actually enhance user satisfaction.
Log and Event Monitoring
Log and event monitoring entails collecting, analyzing, and interpreting logs and events generated by network devices, servers, and applications. It plays a crucial role in troubleshooting, compliance, and security incident detection, providing a bird’s-eye and granular view into how users are using a specific network.
Organizations often employ a combination of these monitoring approaches to extensively manage their network infrastructure and maintain its integrity in all areas.
Network Monitoring Protocols
Monitoring tools use various protocols to collect data from network devices. These protocols facilitate communication between the monitoring system and the devices being monitored. Some common network monitoring protocols include:
- Simple Network Management Protocol (SNMP): SNMP is widely used for monitoring and managing network devices like routers, switches, and servers. It allows for the retrieval of information about device status, configuration, and performance.
- Flow-based Protocols (NetFlow, sFlow, IPFIX): These protocols capture network flow data, providing insights into traffic patterns, source-destination pairs, and bandwidth usage.
- Packet Capture (PCAP): Packet capture tools capture and analyze individual network packets. They are essential for in-depth traffic analysis and troubleshooting.
- Internet Control Message Protocol (ICMP): ICMP (Internet Control Message Protocol) powers tools like Ping, which is a simple yet effective protocol for checking the availability of network devices. It may also include traceroute, which traces the path taken by packets to reach their destination, helping to identify network issues.
- Syslog: Syslog is used for collecting log messages generated by network devices and applications. It’s crucial for monitoring system events and security incidents.
- Cisco Discovery Protocol (CDP): While specific to Cisco devices, CDP provides valuable insights into the details of neighboring network devices, helping with the discovery and management of Cisco equipment within the network.
- ThousandEyes Synthetics: ThousandEyes Synthetics employs synthetic monitoring to emulate user interactions with applications, which provides comprehensive insights into the end-user experience.
The OSI Seven Layer Model
Speaking of network protocols, the OSI (Open Systems Interconnection) model serves as a conceptual framework to understand and standardize the interactions between different networking protocols. This allows devices from different manufacturers to communicate with each other with ease. It comprises seven distinct layers, each with specific functions and responsibilities that contribute to the successful transmission of data within a network.
The first layer is the Physical Layer, which deals with hardware communication mediums, such as cables and connectors. Its primary role is to ensure the reliable transmission of bits over the network through these physical means.
Above that layer is the Data Link Layer, which addresses errors in data frames to ensure that data can be sent and received without corruption.
Moving further up, the Network Layer handles routing and addressing, making decisions about how data packets are routed across the network. It is also where network congestion can be managed.
Sitting atop the Network Layer is the Transport Layer, responsible for end-to-end communication and data segmentation. It ensures that data is reliably delivered between two devices, managing the flow of data and maintaining its integrity.
The Session Layer is the next layer. It manages sessions or connections between devices and deals with session establishment and termination. The Session Layer keeps track of who is communicating and how.
The Presentation Layer, the layer above the Session Layer, handles data format and translation, ensuring that data sent by one device can be understood by another.
Finally, at the top of the stack is the Application Layer. Applications and user interfaces reside here. This layer is where data is ultimately processed and presented to users.
Understanding the OSI model and the functions of each layer can be immensely helpful for network administrators and IT professionals. It offers a structured approach to diagnosing and resolving network problems at a specific layer, which can streamline the resolution process.
What Are Some Challenges Involved With Network Monitoring?
While network monitoring is essential, it comes with its own set of challenges, such as:
- Scale and Complexity: Large-scale networks with numerous devices and services can be challenging to monitor comprehensively.
- Data Overload: Networks generate vast amounts of data, leading to data overload. Effective monitoring requires tools to filter and analyze this data.
- Visibility: Some parts of a network may be less accessible or visible, making it difficult to monitor them effectively.
- Security Concerns: Securing the monitoring infrastructure is crucial.
- Alert Fatigue: Too many false alerts can overwhelm administrators, causing them to miss critical issues.
- Resource Overhead: Monitoring tools can consume network resources, affecting overall performance.
- Cost: Implementing and maintaining a network monitoring solution can be costly, especially for large organizations.
What is the best way to pinpoint network issues? Start by gaining a deeper understanding of the nodes and endpoints that connect to your network on a regular basis.
Common Network Devices
Understanding the functions and significance of these common network devices is essential for effective network management and troubleshooting and can help your business better supervise user activity and hardware maintenance. Be mindful of the following devices:
1. Routers
Routers determine the best path for data to travel from one network to another. They use routing tables to make decisions, directing data packets to their destinations. Routers are crucial for connecting networks, such as your local area network (LAN), to the internet and ensuring data reaches its intended recipient.
2. Switches
Switches operate within a LAN and help manage data traffic efficiently. Unlike hubs, which blindly broadcast data to all connected devices, switches make intelligent decisions based on MAC (Media Access Control) addresses. This results in faster and more efficient data transmission, as data is only sent to the device that needs it.
3. Firewalls
Firewalls scrutinize incoming and outgoing network traffic, filtering and controlling data packets to prevent unauthorized access and protect against cyber threats. Firewalls can be implemented as hardware appliances or software solutions.
4. Load Balancers
Load balancers distribute network traffic across multiple servers or resources to ensure even traffic allocation and optimal utilization. This balancing act enhances availability, reliability, and performance for applications and services and prevents any single server from becoming overwhelmed.
5. Servers
Servers host applications, websites, and services that clients access over the network. These services can include email, file storage, web hosting, and databases. Monitoring server performance is crucial for maintaining uninterrupted service delivery.
6. Access Points (APs)
Access Points (APs) enable wireless devices to connect to a wired network. They provide Wi-Fi connectivity, extending network access to laptops, smartphones, tablets, and other wireless devices. APs play a critical role in maintaining wireless network performance.
7. Modems
Modems are responsible for converting digital data from a network into analog signals suitable for transmission over telephone lines (DSL modems) or cable lines (cable modems). They are often used by Internet Service Providers (ISPs) to provide internet access.
8. Gateways
Gateways connect networks with different communication protocols, allowing them to exchange data. For example, an email gateway may translate email messages from one format to another, ensuring seamless communication between different email systems.
Each device plays a unique part in ensuring data flows smoothly, securely, and efficiently throughout a network, making them integral components of modern network infrastructure that all admins should be familiar with.
Network Optimization Techniques
Technology is always changing and upgrading—and so should your network. Otherwise, you risk future device incompatibility issues, latency, and other obstacles that can hinder your network’s performance. Keep your network ahead of the game with these recommended tools and techniques:
- Quality of Service (QoS): QoS tools prioritize certain types of network traffic, ensuring that critical applications receive sufficient bandwidth and low latency. This is particularly crucial in environments where applications like video conferencing or voice over IP (VoIP) need to operate smoothly, even when the network is under heavy load.
- Traffic Shaping: Traffic shaping controls the flow of data to prevent network congestion, smoothing out traffic by regulating data transmission rates.
- Caching: Caching involves the storage of frequently accessed data locally, reducing the need to retrieve it from remote servers. This technique significantly speeds up data retrieval, reduces latency, and conserves bandwidth. It’s especially valuable for content-heavy websites and applications, as it minimizes the strain on servers and enhances the user experience by delivering content more quickly.
- Load Balancing: Load balancers distribute traffic evenly among multiple servers, preventing any single server from becoming overloaded. It also ensures that each server operates within its capacity, maximizing efficiency and uptime.
- Compression: Data compression is an effective way to reduce the size of transmitted data, conserving bandwidth and accelerating transmission speed. It’s particularly beneficial for data-intensive applications like file transfers and media streaming, as compressing data before transmission and decompressing it at the receiving end enables networks to transmit data faster and more efficiently.
- Content Delivery Networks (CDNs): CDNs use distributed servers to deliver content closer to end-users, reducing latency and improving content delivery speed. CDNs are indispensable for delivering web content, streaming services, and large files quickly and reliably to a global audience.
- Network Upgrades: Sometimes, network performance issues can be resolved by upgrading hardware or increasing bandwidth capacity. This technique involves investing in newer, more capable network equipment or scaling up network capacity to meet growing demands. It’s a fundamental strategy to future-proof your network and ensure it can handle evolving technology requirements.
Network optimization should be an ongoing process, with monitoring tools providing the data needed to make informed decisions about which techniques to employ.
How Do Network Monitoring Alerts Work?
At the core of network monitoring alerts is the concept of thresholds. Administrators define these thresholds as specific values or conditions that indicate normal network behavior. These thresholds can be set for various network metrics, such as bandwidth usage, latency, CPU utilization, or device availability. They essentially establish the boundaries of what is considered acceptable or expected network performance.
Network monitoring tools continuously collect data from various network devices and systems, analyzing it against these predefined thresholds. When a monitored metric exceeds or falls below its threshold (for example, bandwidth usage surpasses a certain limit or response times exceed acceptable levels), the monitoring tool generates an alert. These alerts can range in severity, often categorized as informational, warning, or critical, depending on the significance of the deviation from the established threshold.
Once an alert is triggered, it can notify network administrators and relevant stakeholders via email, SMS messages, or even collaboration tools like Slack or Microsoft Teams. The goal is to ensure that the right people are informed promptly.
In some cases, alerting mechanisms may include escalation procedures. This means that if an alert is not acknowledged or resolved within a specified timeframe, it can be automatically escalated to higher-level personnel or teams, ensuring that critical issues receive the attention they need.
Advanced monitoring systems often include alert correlation capabilities. These systems can correlate multiple alerts to identify the root cause of a problem. This feature reduces alert fatigue by presenting administrators with a more comprehensive view of the issue rather than inundating them with individual alerts for interconnected problems.
Best Practices for Network Monitoring
To ensure that your network monitoring efforts are successful, here are some best practices to consider:
Define Clear Objectives
Begin by clearly defining your network monitoring objectives. Determine what you want to achieve through monitoring and why it’s essential for your organization. Understanding your specific goals will guide your monitoring strategy and help you prioritize what to monitor.
Select the Right Tools
Choose network monitoring tools that align with your objectives and network infrastructure. Consider factors such as scalability, compatibility with your network devices, and the range of metrics they can monitor. The right tools should provide the visibility you need without overwhelming you with unnecessary data.
Set Realistic Thresholds
Establish thresholds for network metrics based on your network’s normal behavior. Avoid setting overly sensitive thresholds that trigger alerts for minor fluctuations. Instead, set thresholds that are relevant to your network’s typical performance, ensuring that alerts are meaningful and actionable.
Monitor Critical Services
Focus your monitoring efforts on critical network services and applications. Identify the services that are vital to your organization’s operations and prioritize monitoring them. This ensures that you can quickly respond to issues that directly impact productivity and customer satisfaction.
Regularly Review and Update
Networks are dynamic, evolving environments, so you need to periodically review your monitoring setup to ensure it remains aligned with your organization’s changing needs. As your network expands or new services are introduced, adjust your monitoring accordingly.
Document Procedures
Document procedures for issue resolution and network troubleshooting and share these procedures with your IT team to ensure a coordinated response when problems arise. Having well-documented processes can significantly reduce downtime and improve efficiency during incident management.
Regular Reporting
Generate regular reports from your monitoring data to track network performance trends and analyze historical data to identify patterns and anomalies. Regular reporting also helps you demonstrate the value of network monitoring to stakeholders and make informed decisions about network optimization.
Security Integration
Integrate security monitoring into your network monitoring strategy. Security threats are a constant concern, and your network monitoring tools can help detect and respond to security incidents. Incorporate intrusion detection, malware scanning, and log analysis into your monitoring practices to bolster network security.
Training
Ensure that your IT team is trained in using monitoring tools effectively. Familiarity with the tools’ features and capabilities enables your team to harness the full potential of network monitoring, from proactive issue detection to efficient troubleshooting.
Data Retention
Determine how long historical monitoring data should be retained. This is not only important for analyzing trends but also for compliance purposes. Some industries have specific data retention requirements that you must adhere to.
By following these best practices, you can establish a robust network monitoring framework that not only helps you proactively manage your network but also contributes to the overall success of your organization. Effective network monitoring ensures that your network remains resilient, secure, and capable of supporting your business objectives.
How to Troubleshoot Network Issues
Troubleshooting network issues effectively requires a systematic and well-structured approach. In order to diagnose and resolve network issues:
- Identify the Problem: Begin by identifying the symptoms and affected areas of the network. Gather information about the nature of the problem. Is it a connectivity issue, slow network performance, or a specific application problem? Clear identification of the problem’s scope is crucial for targeted troubleshooting.
- Gather Information: Collect relevant information from your network monitoring tools and devices. This data includes network performance metrics, error logs, and event records. Insights from these sources help you understand the current state of the network and any deviations from normal behavior.
- Isolate the Cause: Use the OSI model to help isolate the layer at which the issue is occurring. Identifying the affected layer narrows down the potential causes of the problem. For example, if the issue is related to a malfunctioning wire, it might be at the Physical Layer.
- Check Configurations: Review the configurations of network devices, including routers, switches, firewalls, and servers. Ensure that configurations are correct and consistent with network policies.
- Review Logs: Analyze logs and event data generated by network devices and applications. Look for error messages, warnings, or anomalies that may provide clues about the issue’s origin. Logs can reveal valuable information about network events and conditions leading up to the problem.
- Use Testing Tools: Leverage network testing tools to diagnose connectivity and routing issues. Tools like ping and traceroute can help pinpoint network nodes that are not responding or identify routing problems. Also, consider packet capture tools that enable you to capture and analyze network traffic to uncover anomalies or misconfigurations.
- Collaborate: Engage with colleagues, subject matter experts, and external vendors if necessary. Collaboration is often essential for resolving complex network issues, especially when they involve multiple network segments, third-party services, or cloud resources. Sharing insights and expertise can expedite problem resolution.
- Implement Solutions: Once you’ve identified the root cause of the issue, implement the necessary changes or fixes. This might involve adjusting configurations, applying patches or updates, or replacing faulty hardware. Ensure that any changes are well-documented.
- Test Solutions: After implementing changes, test the network to ensure that the issue has been resolved. Monitor the network to confirm that performance has improved and that the problem no longer exists. Conduct thorough testing to prevent recurrence.
- Documentation: Document the entire troubleshooting process, including the steps taken, the root cause identified, and the solutions applied. Well-documented troubleshooting records serve as a valuable resource for future reference and knowledge sharing among your IT team.
- Preventive Measures: Consider implementing preventive measures to reduce the likelihood of similar issues in the future. This may include updating configurations, enhancing security measures, or adjusting monitoring thresholds. A proactive approach helps minimize network disruptions.
- Continuous Monitoring: Even after resolving the issue, continue to monitor the network to ensure that the problem remains resolved. Ongoing monitoring helps detect any new issues that may arise and allows you to address them promptly before they impact network performance.
How to Choose a Network Monitoring Solution
Network monitoring shouldn’t be a manual feat. Consider automating tedious and repetitive tasks by using a network monitoring solution. To make the right choice, you should consider several key factors.
First, evaluate the scale and complexity of your network. Understanding the number of devices, servers, and applications you need to monitor is key. Smaller networks may benefit from simpler solutions, while larger and more complex enterprise networks require advanced and scalable tools.
Next, carefully examine the feature set and capabilities of the network monitoring tool. Make sure that it supports the specific metrics, protocols, and services relevant to your network. Features like real-time monitoring, automatic device discovery, customizable alerting, reporting, and integration options may be useful to your business. You’ll want a solution that provides the features necessary to meet your monitoring objectives.
User-friendliness is another crucial consideration. An intuitive and well-designed user interface simplifies configuration, data visualization, and troubleshooting. An easy-to-use interface can reduce the learning curve and increase the efficiency of your IT team—especially if your team includes non-technical users. Scalability also enables your internal teams to handle the growth of your network, accommodating additional devices, increased data volume, and more complex monitoring scenarios as your organization expands.
Don’t forget about alerting mechanisms. While most network monitoring software comes equipped with alerting capabilities, an excellent one supports various notification methods like email, SMS, SNMP traps, and integration with collaboration tools. You should also look for a product that allows you to define alerting thresholds and severity levels.
Integration capabilities are vital for sharing data with other systems and tools in your network environment. Check if the monitoring solution seamlessly integrates with ITSM systems, ticketing systems, cloud platforms, and other third-party applications. Likewise, don’t overlook the importance of customer support, documentation, and user community forums. Reliable customer support can be a lifeline for resolving issues and receiving assistance. Comprehensive documentation and an active user community provide valuable resources for troubleshooting and knowledge sharing.
Finally, security is paramount. Ensure that the monitoring solution itself is secure and does not introduce vulnerabilities to your network. Verify that it follows best practices for security and offers features like role-based access control and encryption.
By carefully evaluating these factors, you can make an informed decision when choosing a network monitoring solution that aligns with your organization’s specific needs, objectives, and budget.
Five Best Network Monitoring Tools
When it comes to network monitoring, several tools stand out for their advanced capabilities and reliability. Here are five of the best network monitoring tools that can benefit your organization.
1. SolarWinds Observability Self-Hosted – Free Trial
©2024 SolarWinds Worldwide, LLC. All rights reserved.
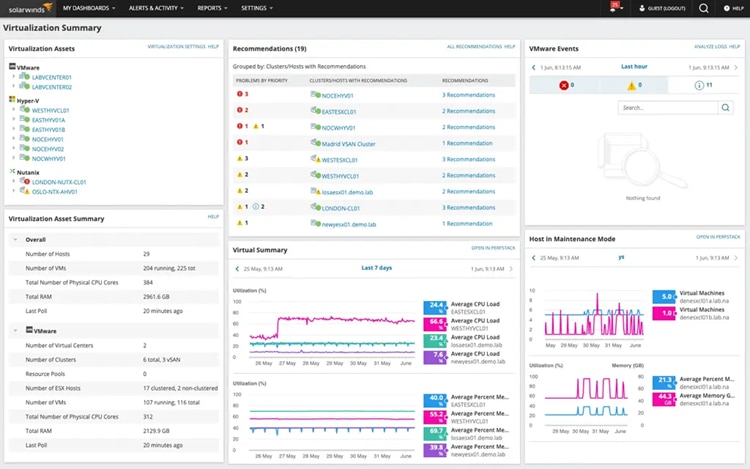
SolarWinds Observability Self-Hosted excels in providing in-depth visibility into complex hybrid and multi-cloud environments. It goes beyond basic monitoring, offering real-time insights into performance metrics, dependencies, and potential issues across your infrastructure. With SolarWinds Observability Self-Hosted, you can optimize resource allocation, ensuring a seamless user experience even in the most dynamic environments.
Learn More Download Free Trial
2. SolarWinds Network Performance Monitor (NPM) – Free Trial
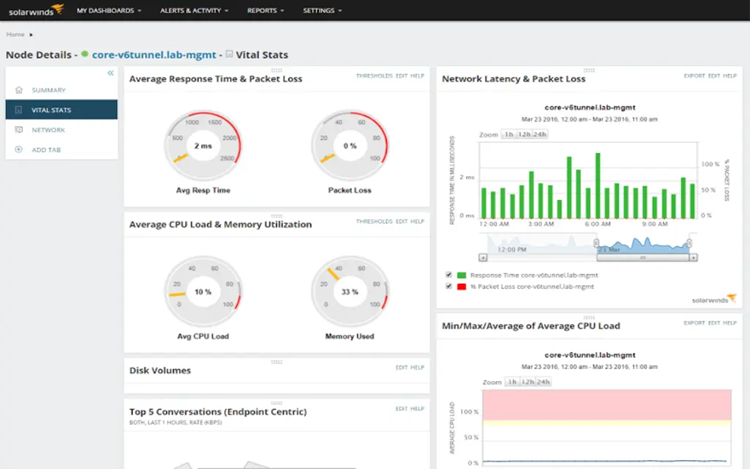
Network Performance Monitor (NPM) stands out for its scalability and user-friendly interface. It boasts automatic device discovery and customizable alerting, making it suitable for networks of all sizes. NPM provides comprehensive insights into network performance, making it an ideal choice for organizations seeking a holistic monitoring solution that can grow with their needs.
©2024 SolarWinds Worldwide, LLC. All rights reserved.
3. PRTG Network Monitor
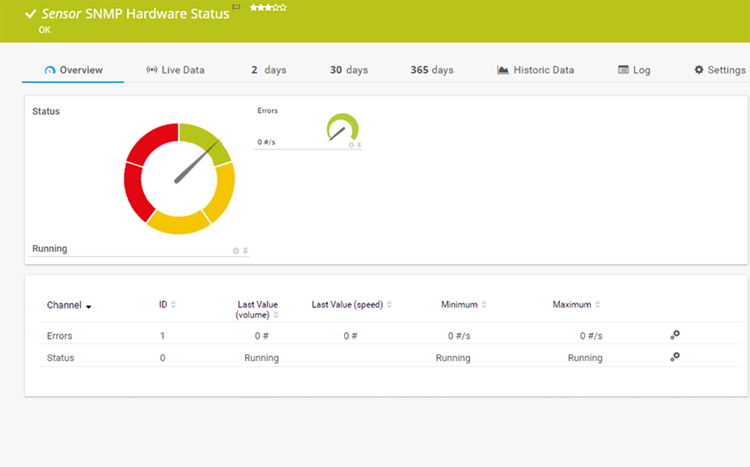
PRTG Network Monitor is renowned for its versatility and broad sensor support, catering to networks of varying sizes. Its interface, customizable dashboards, and robust reporting capabilities make it a worth considering choice for network administrators.
©2024 Paessler AG
4. ManageEngine OpManager
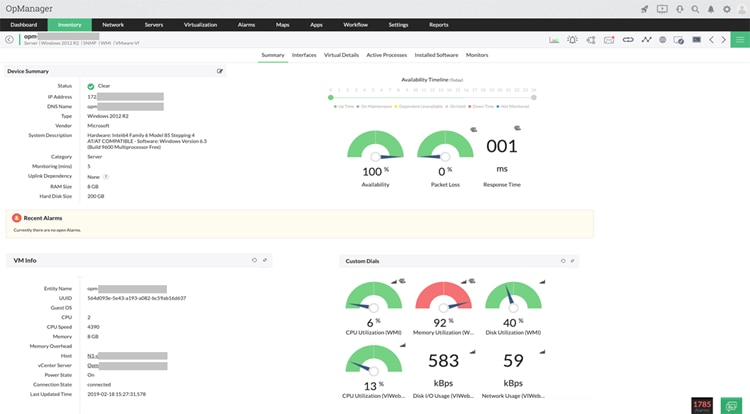
OpManager is a network monitoring and management tool with a multitude of features. It offers real-time performance monitoring, intelligent alerting, and automation capabilities. OpManager’s integration with other ManageEngine products further enhances its appeal, making it an all-in-one solution for organizations seeking network management.
© 2024 Zoho Corporation Pvt. Ltd. All rights reserved.
5. Datadog
Datadog sets itself apart as a cloud-native monitoring and analytics platform. It offers end-to-end visibility into networks and applications, making it suitable for organizations operating in hybrid or cloud environments. With infrastructure monitoring, APM, and log management, Datadog leverages machine learning and extensive integrations to provide unparalleled insights into your network’s performance and health.
© Datadog 2024
Monitor Your Network for Long-Term Success
Though it involves a lot of elbow grease, network monitoring is essential to the health of any business’s overall IT environment. Organizations should invest in network monitoring as a strategic necessity, as it allows them to identify issues, minimize disruptions, allocate resources wisely, enhance user experiences, and safeguard crucial data. In the interconnected and increasingly digital world we live in, network monitoring is the key to resilience and competitiveness, providing uninterrupted connectivity that drives success no