
WhatsUp Gold is a popular tool for executing network monitoring processes. Before considering viable WhatsUp Gold alternatives, I’ll quickly go over why WhatsUp Gold monitoring is so effective, so you know what to look for in its replacement.
Skip to Best WhatsUp Gold Alternative Tools >>>
What Is WhatsUp Gold Software?
WhatsUp Gold is software designed to give you in-depth insight into the performance and status of devices connected to the network, applications, and servers—whether on-premises or cloud-based. It’s a versatile tool, with a range of intuitively designed features. These include:
Discovery: Many network monitoring tools have automatic discovery capabilities to make mapping your network and all the connected hardware easier and faster, but some are more basic than others.
WhatsUp Gold uses layer 2/3 discovery methods (e.g., virtual infrastructure management, IP addressing, ARP, SSH, SNMP, ICMP, LLDP) alongside vendor-proprietary operations. This means everything connected to your network can be automatically discovered, affording you complete visibility. It also gives you insight into port-to-port connectivity.
The discovery process can be scheduled and automated, if you’d like, or you can run it on-demand. Discoveries can either be partial or full. With WhatsUp Gold, you can discover servers, devices, deployed software, VMware virtual machines, LANs, and more with little to no manual intervention.
Mapping: Network maps are another useful feature of WhatsUp Gold. Topology maps (layer 2 and 3) are autogenerated, giving you a graphical and practical way of viewing your network. You’ll gain a better understanding of virtual, physical, and logical connectivity. Maps are updated in real time, as and when a change is identified. They can be customized to suit your needs and preferences and can be exported to PDF or Microsoft Visio format.
Alerting: WhatsUp Gold also comes with a built-in, real-time alerting system. This keeps you up-to-date on performance and availability, which is extremely helpful when it comes to meeting service-level agreements. Alerts are customizable, so you can decide when and how you want to be notified. This is great for preventing floods of useless alerts, as you can tweak your settings, so you’re only notified when something is a priority.
Customization: In fact, much of WhatsUp Gold is customizable, including dashboards, maps, settings, and reports. Flexible, customizable tools are something to look for in your WhatsUp Gold network monitoring software alternative.
Workflow Management: Getting to the root of a problem and resolving it is easy with WhatsUp Gold, which features clever and customizable workflows to assist in minimizing MTTR. Via the interactive maps, you can initiate management processes through a well-thought-out design. You can also switch between virtual, physical, wireless, and dependency views as desired, which can help in resolving problems.
Integration: I also appreciate WhatsUp Gold’s ability to integrate and automate with REST API. You’re able to integrate monitoring data with other systems and automate a wide range of tasks and activities, including removing and adding new devices.
Add-on Capabilities: The last WhatsUp Gold feature I’m going to mention is the ability to extend its core capabilities with add-on modules. This includes network traffic analysis, application performance monitoring, configuration management, virtualization monitoring, and failover management.
What to Look for in a WhatsUp Gold Alternative Tool
WhatsUp Gold is bursting with features, but which are the most important? Which are central to its success as a network monitoring solution?
While alternative tools may not offer the exact same capabilities, certain components are nonnegotiable. A viable alternative will at least feature the following components:
- User-friendly user interface (UI)
- Agent and agentless monitoring capacity
- Full enterprise infrastructure and network management/monitoring capabilities
- WMI, SNMP, and NetFlow monitoring and analysis utilities
- Bandwidth monitoring and analysis utilities
- Bandwidth utilities
- Linux/Unix, Mac OS X, and Windows Server monitoring utilities
As I mentioned earlier, WhatsUp Gold is a very comprehensive tool. To sum up briefly, it can monitor all of the following:
- Application performance
- Bandwidth consumption
- Cloud-based resources
- Network performance
- Hyper-V and VMware
- Wireless networks
Since it can do so much, you may be wondering why you need a WhatsUp network monitoring alternative at all. Why not just use WhatsUp Gold?
While many competing network monitoring solutions on the market offer the same functionality and capacity as WhatsUp Gold, the layouts, user interfaces, and overall user-friendliness vary significantly from tool to tool. Though WhatsUp Gold is impressive, other tools out there can rival, if not outshine it. I believe these programs can help make the network monitoring experience simpler, faster, more sophisticated, and even more enjoyable.
In this guide, I’m going to give special consideration to WhatsUp Gold vs. SolarWinds, because I view SolarWinds® Network Performance Monitor (NPM) as the best WhatsUp Gold alternative available. SolarWinds has a reputation for producing some of the most intelligent, powerful, and user-friendly applications around, so its products are obvious contenders. Later in the guide, I will also outline other WhatsUp Gold monitoring alternatives.
WhatsUp Gold vs. SolarWinds As Of April 28, 2020
Let’s take a look at SolarWinds NPM and SolarWinds ipMonitor and how each compare to WhatsUp Gold. SolarWinds NPM is the main competitor here, so I’ll give it the most attention, but the free version of ipMonitor is nonetheless worth mentioning as a WhatsUp Gold free alternative.
SolarWinds Network Performance Monitor
Both WhatsUp Gold and SolarWinds NPM are extremely feature-rich tools, each with its own intelligent and unique design approach, so comparing the two is tricky. To make it simpler, I’ve broken my comparison down into sections. First, I’ll summarize what NPM can do that WhatsUp Gold can’t. Then, I’ll give a detailed overview of NPM’s core features (to read a complete NPM features list click here) with regard to server and hardware monitoring, critical application monitoring, VMware and Hyper-V monitoring, and scaling and extensions.
Advantages of NPM vs. WhatsUp Gold
The following features included in SolarWinds NPM:
Hop-by-Hop Network Path Analysis: The NetPath™ utility included in NPM lets you view traffic, performance, configuration, and application data, whether in hybrid or cloud-based environments or installed on-premises. This is a feature WhatsUp Gold does not provide, which is a shame because it’s very useful.
Drag-and-Drop Performance Metrics: This is one of my favorite features. NPM speeds up root cause identification significantly by letting you drag and drop metrics onto a shared timeline. This gives you a way of visualizing correlation and relationships across your network, which makes identifying issues much easier. This feature is one of many examples that demonstrate the superiority of NPM’s UI over WhatsUp Gold’s.
Network Insight™: NPM gives you insight into Cisco ASAs and lets you manage and monitor the Cisco ASA environment. WhatsUp Gold cannot, unfortunately, give you any Cisco ASA visibility.
Route Monitoring and Network Multicast Monitoring: WhatsUp Gold doesn’t offer either of these monitoring capabilities. NPM, on the other hand, can monitor and analyze routing tables and will notify you if anything is amiss. It also tracks routing protocols (e.g., OSPF, BGP, RIP). NPM can monitor, report, and alert on multicast topologies, even if they’re complex.
These are just the most notable examples of what NPM can do that WhatsUp Gold can’t. As I go on to explore some of NPM’s other impressive functionalities, other differences between these two products will come up.
Core Features of NPM
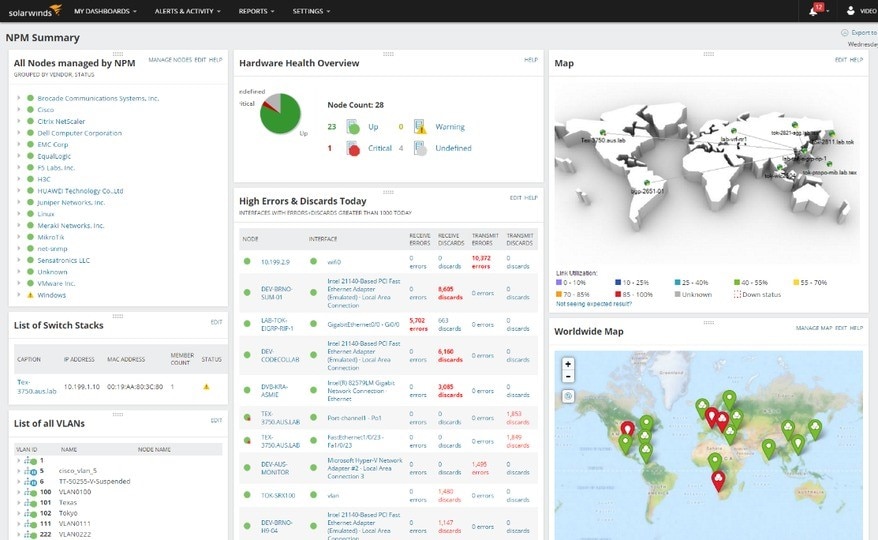
SolarWinds NPM is a fantastic tool with performance analysis capabilities, fault monitoring, availability monitoring, cross-stack data correlation, and more. When it comes to server and hardware monitoring, it undertakes uptime monitoring (with Ping/ICMP), event log monitoring, and performance monitoring. Essentially, NPM covers the key aspects of servers and hardware, giving you a comprehensive monitoring solution. Each of these components comes with triggers, events, and thresholds, which you can tweak to your preferences. You’ll be notified when thresholds are breached, so you’re never out of the loop.
Hardware Monitoring: As a WhatsUp Gold monitoring alternative, NPM takes hardware monitoring to the next level. It gives you access to native monitoring for IBM, Dell, and HP health indicators. WhatsUp Gold, on the other hand, only supports SNMP MIBs. In terms of server management, NPM allows you to kill processes, with the option to start, stop, restart, and shut down servers. By contrast, WhatsUp Gold’s server management utilities only cover Traceroute, Telnet, Browser, Ping, and RDP.
NPM supports Windows Server, Solaris, Hyper-V and VMware vSphere, Linux/Unix, HP-UX, and AIX. WhatsUp Gold is SNMP-based.
Application Monitoring: Application monitoring capacity is another important consideration when choosing your WhatsUp Gold network monitoring alternative. NPM boasts native templates for common applications. It supports over 200 applications, offers a range of SQL Server monitoring functionalities (for performance, query, log size, fragmentation, etc.), and features a centralized event console. WhatsUp Gold requires add-ons or plugins for many of these features in its Premium, MSP, and Distributed editions, which cost extra. They are included in the Total Plus edition.
VM Monitoring: Regarding VMware and Hyper-V monitoring, WhatsUp Gold requires add-ons at additional costs depending on the edition for most functionalities. NPM, on the other hand, offers built-in compatibility with both VMware vSphere and Hyper-V. You can view resources and counts for virtual and host machines by hypervisor in the VM inventory summary, and you can monitor the following resources: CPU/processor, network traffic, utilization for host and virtual machines, and memory consumption on host and virtual machines.
Scalability: The issue of scalability and extensibility really comes down to preference. With WhatsUp Gold, you can extend the offering with paid add-ons, and some of you may value this flexibility. Personally, I prefer having a tool like NPM because it has enormous scope, and no add-ons are necessary.
A 30-day free trial of NPM is available.
SolarWinds ipMonitor Free Edition
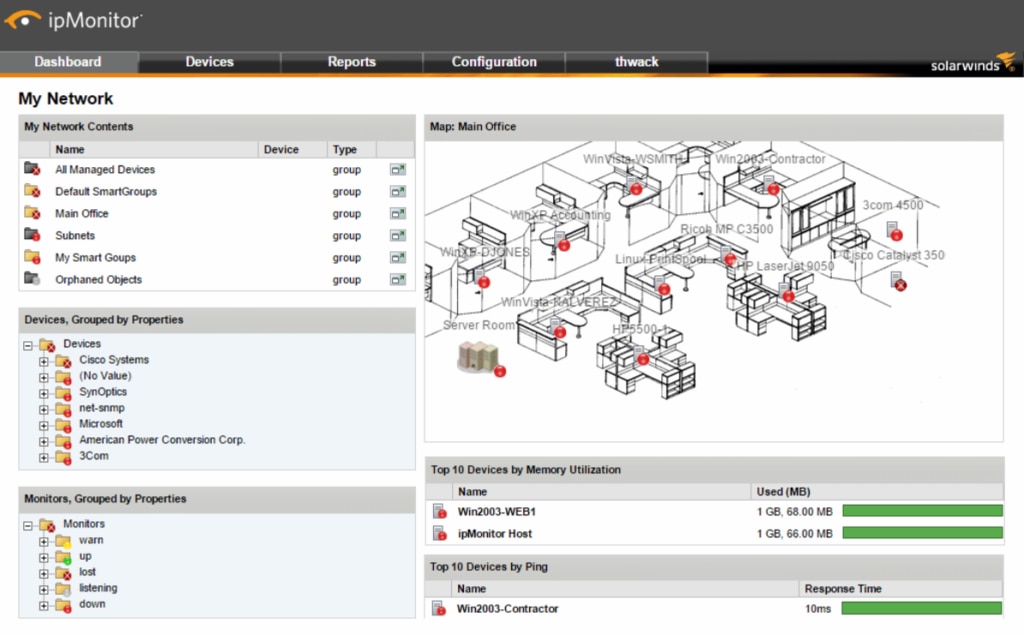
SolarWinds ipMonitor is designed to be a simple tool to monitor servers, applications, and devices on the network. It delivers alerts pertaining to availability and performance problem indicators, with automated remediation actions and built-in reports.
SolarWinds ipMonitor happens to be quick and easy to launch. With the Startup Wizard, you’re guided through the launch processes step by step. These include the automated discovery process and the configuration of alerts. The Startup Wizard provides you with out-of-the-box instructions, helping you decide what to monitor for each device and application. This is useful for beginners, or for professionals who are new to SolarWinds products. I personally really appreciate these support features. Though using SolarWinds tools requires next to no training or prior knowledge, knowing the support is there is reassuring.
A decent alerts system is valuable, but alert functionalities can be hit or miss with many tools. ipMonitor employs a system to reduce the number of unimportant alerts you get, while helping ensure you don’t miss anything that might be concerning. You can customize your alerts, so you receive them the way you want to, with over a dozen notification types to choose from. You can opt to be notified via SMS, email, or even the Windows event log files.
Free tools are known for skimping on user-friendliness, because they don’t always put the same amount of effort into the user interface and dashboard as paid tools. ipMonitor is an exception to this rule, having a dynamic and uncluttered dashboard to make data interpretation effortless. I especially like the organization of the dashboard, which resembles a typical computer files repository, with folders and subfolders. This is familiar and easy to use.
The console doesn’t give you too much information at once. Instead, you have the option of drilling down into an issue to gain visibility of specific metrics and data. This means the information is available on demand, when you need it, instead of flooding your console and making everything harder to interpret. With network maps and Network Operations Center view, problem resolution becomes significantly easier.
The automated remediation actions are another generous contribution, considering the tool won’t cost you a penny. They allow you to restart failed Windows services and applications, and reboot servers, run scripts, and back up files.
The monitoring process itself is another benefit of ipMonitor. The graphical representation of data is colorful, engaging, and easy to read, making monitoring historical performance simple. The built-in reports, which are customizable, are also notable. You can “point and shoot” to zoom in on reports, so you can view data from a specific time or event. This is useful for identifying the root cause of an issue. Reports can be scheduled for delivery by email.
Overall, the free version of ipMonitor is a great WhatsUp monitoring alternative if you have your heart set on a free program. The paid version is also a viable option, though if you’re going to go for a paid product I’d recommend choosing SolarWinds NPM instead. You can access the free edition of ipMonitor here.
Other WhatsUp Gold Alternatives
ManageEngine OpManager
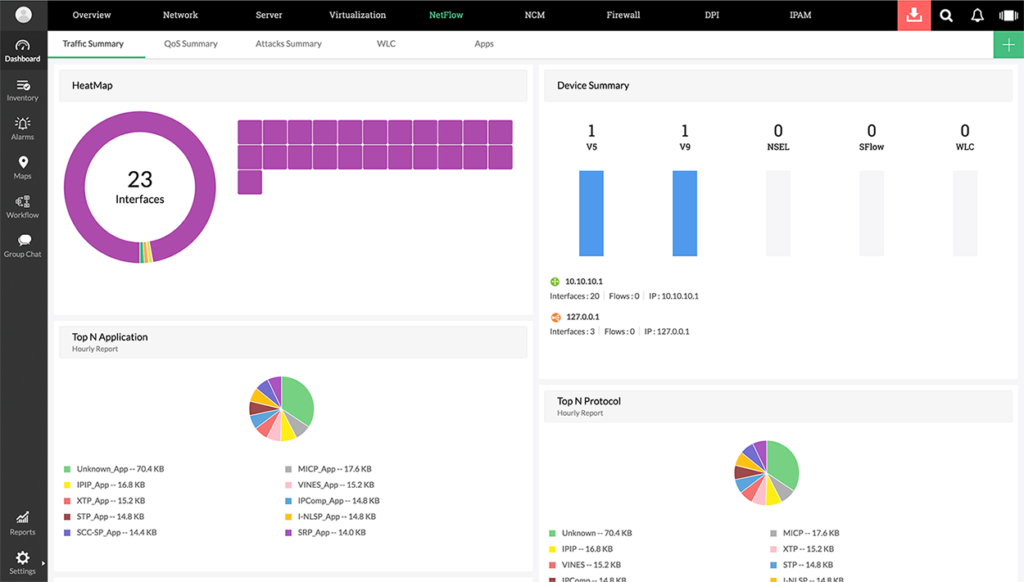
ManageEngine, like SolarWinds, is a big name in software development, particularly well-known for its network monitoring tools. OpManager is both feature-rich and easy to use. It has over 2,000 built-in monitors for network performance, covering latency, packet loss, speed, discards and errors, performance bottlenecks analysis, and much more. These monitors aren’t plugins or add-ons, but fully integrated into the software.
With this tool, you get end-to-end visibility. You’ll gain insight into your wireless network, WAN links, local devices, printers, access points, and so on. Data is often graphically represented, with dials, charts, and graphs making interpretation effortless. You’re afforded at-a-glance insights in real time, without a flood of information to complicate your view of the console. Clarity of data is an important feature of any monitoring tool, so this is a big benefit.
OpManager lets you monitor disk utilization, memory, and CPU for both Linux and Windows servers. You can also monitor the performance of Hyper-V and Xen virtualization platforms, as well as VMware host and virtual machines.
The multi-level thresholds approach to monitoring is another useful utility. You can establish numerous thresholds for each critical performance monitor to receive notifications when a threshold is breached.
The OpManager dashboards are customizable: you can either tweak the default dashboards or create your own from scratch. In doing so, you’ll be able to draw on more than 200 performance widgets, which make it possible to get an instant overview of your network.
This tool doesn’t require any training to get started, and the installation process is easy. The pricing model is device-based, which means you don’t pay for more than you need. Check out the 30-day free trial.
Nagios XI
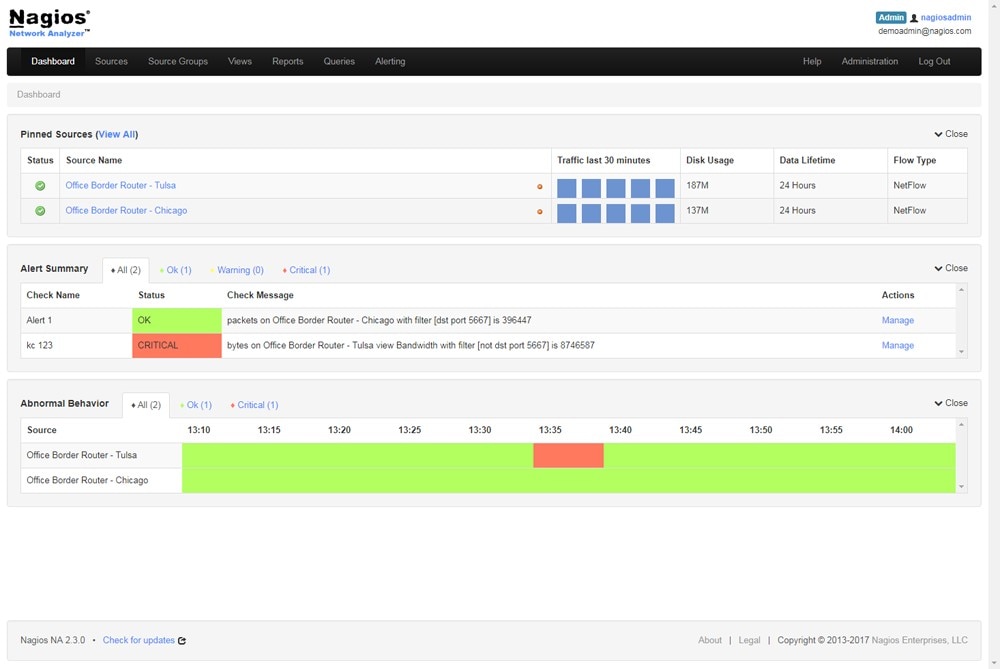
Nagios XI is an enterprise network and server monitoring solution with a comprehensive approach. It centralizes your monitoring processes, so you don’t have to jump between different tools.
This tool makes my list primarily because of its extendable architecture. The software uses multiple APIs to enable integration with third-party and in-house applications. Moreover, Nagios is supported by a large volume of loyal customers, who continue to extend the program by contributing to a pool of thousands of community-developed add-ons. This community-based approach to extendibility makes Nagios stand out from many other products. While I personally prefer not to use tools requiring add-ons or plugins, I don’t view that as grounds to exclude Nagios XI from this guide. If you like the idea of a community-based program, then you might benefit from this approach.
Because this tool is aimed at enterprise clients, it’s sophisticated. This does not, however, mean it’s particularly difficult to use. While it’s not as user-friendly as it could be, it offers a useful quick-start feature, which prevents you from needing to manually configure it step by step. Nagios also has knowledgeable tech advisors on hand, so you can get assistance easily enough if anything goes wrong—they can even deploy Nagios XI with a remote assist installation. While this is a valuable offering, other tools don’t need to offer extensive assistance, because their installation and setup process is simple.
Customizability, as we’ve already discussed, is an important aspect to consider when choosing your network monitoring alternative. Nagios XI benefits from a UI that allows you to customize design, layout, and preferences. You can do this on a per-user basis, giving you ultimate flexibility.
Nagios XI also comes with multi-tenant capabilities. Multiple users can access the web interface, which means stakeholders can gain real insight into the status of the infrastructure. Access is restricted via customizable user-specific views, so clients can only view the elements they’re authorized to see. Managing user accounts is simple, and you can create and provision new accounts typically in a few minutes. Once set up, a user will receive an automated email with their login details.
Nagios XI users benefit from trending and capacity planning graphs that are automated and fully integrated, assisting you in preparing for infrastructure upgrades before a system becomes outdated. The relevant alerts are sent to stakeholders, IT team members, and end users, notifying these parties of outage details, so they can resolve the issue as quickly as possible. Alerts can be sent via email or SMS.
You can download a 60-day free trial of Nagios XI. There are different download links for Microsoft, VMware OVA, and Linux. Alternatively, you can view the online demo, or schedule a quick start. A free version of Nagios is available, but this is only suitable for small network environments.
Paessler PRTG Network Monitor
PRTG Network Monitor, by Paessler, is a well-known and widely used tool. It’s a strong contender because it provides such a comprehensive monitoring solution. It covers bandwidth, applications, databases, LANs, servers, SNMP, cloud, and much more. It supports major technologies, including SNMP, WMI and Windows performance counters, SSH, HTTP requests, REST APIs returning JSON or XML, Ping, and SQL—and the list goes on.
My favorite thing about PRTG Network Monitor, besides its versatility, is the way data is represented. The graphs are dynamic, colorful, and easy to read, and are afforded an appropriate amount of space on the dashboard. Information doesn’t feel messy or overwhelming, and the interface has a clean aesthetic. You can create your own dashboards with the built-in map designer and integrate the components of your network by using over 300 map objects—for example, status icons, top lists, and traffic charts.
A monitoring solution is only as good as its alerts system, and PRTG Network Monitor’s flexible approach to alerting is an obvious benefit of the program. There are built-in notification mechanisms, which support push, email, and HTTP requests. Push notifications can even be delivered straight to your phone, via the PRTG app. This app is available for Android and iOS, and the program is surprisingly well suited to the mobile interface.
PRTG takes a sensor-based approach to monitoring, and I see this as its major pitfall, purely because the per-sensor pricing model means you could end up paying for more than you need. Nonetheless, this is an impressive tool. If you want to see whether it works for you, a 30-day free trial is available. After the trial period ends, the program reverts to a free version.
Best WhatsUp Gold Alternative Software
WhatsUp Gold is a popular tool, with plenty to recommend it, but tools on the market can compete with and even surpass it. If you’re looking for a WhatsUp Gold alternative for network monitoring that incorporates its best and key features but expands on those capabilities, you can’t go wrong with SolarWinds Network Performance Monitor.
With its intelligent design, user-friendliness, dynamic and supported UI, and extensive functionalities, NPM is everything you could want in a WhatsUp Gold alternative. For a program that maximizes usability, requires no training or former knowledge, and brings you a combination of sophistication and simplicity, download the fully functional 30-day free trial.