
Having a tool for network and IT management is crucial for IT departments of all sizes. Spiceworks offers a suite of IT management tools that serves as a great free solution. These various tools can be used together to provide a range of functions, including help desk team management, multi-site support, and inventory management.
However, the free Spiceworks suite has its limitations, leading businesses to seek out Spiceworks competitors. One major issue is that you need to coordinate between a number of individual tools in order to have any form of successful IT management. What’s more, the Spiceworks Network Monitor tool was phased out as of January 2020. When considering alternatives to the Spiceworks suite of tools, you’ll want to look for the following features united within one product:
- Licensing inventory for hardware and software
- Automatic discovery for network components
- Alerts and monitors during downtime
- Reporting on the network and hardware
- Bandwidth analysis of critical network components
- Network topology mapping
With this in mind, here are what I consider the top Spiceworks competitors on the market. I’ve led with two solutions from SolarWinds, a highly reputable company known for its Orion® Platform of products. Businesses in the market for Spiceworks alternatives can’t go wrong with SolarWinds® Network Performance Monitor and SolarWinds Server & Application Monitor, both of which offer free trials.

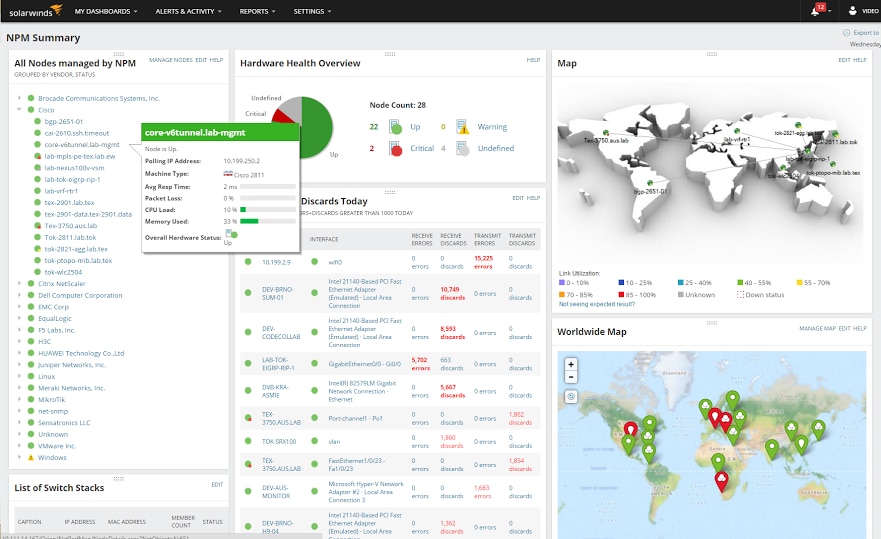
The first alternative to Spiceworks tools like the Connectivity Dashboard to consider is SolarWinds Network Performance Monitor (NPM). NPM provides advanced infrastructure monitoring and network troubleshooting, with support for cloud, on-premises, and hybrid services.
NPM uses procedures based on the Simple Network Monitoring Protocol (SNMP), the industry standard. With SNMP, devices on the network have an agent program installed, and NPM acts as the central controller.
NPM supports IT asset and inventory management with automatic device discovery, freeing you up from configuring the system manually. Instead, the tool can identify devices automatically with SNMP messaging, similar to SNMP discovery within the Spiceworks Inventory tool.
In addition to discovery, NPM performs network monitoring to track the status of the devices. When something goes wrong, you’ll receive a notification and be able to view the information on a dashboard. Likewise, Spiceworks Connectivity Dashboard provide in-app and email-based alerts, although their metrics are more limited and for some devices include only uptime/downtime tracking.
NPM’s alert system has several advanced features. It comes with default alerts, but you can also create custom, intelligent alerts to notify you of situations specific to your business needs. Further flexibility comes with defining when and how alerts should be sent and including enough information in the alert, so you can act right away.
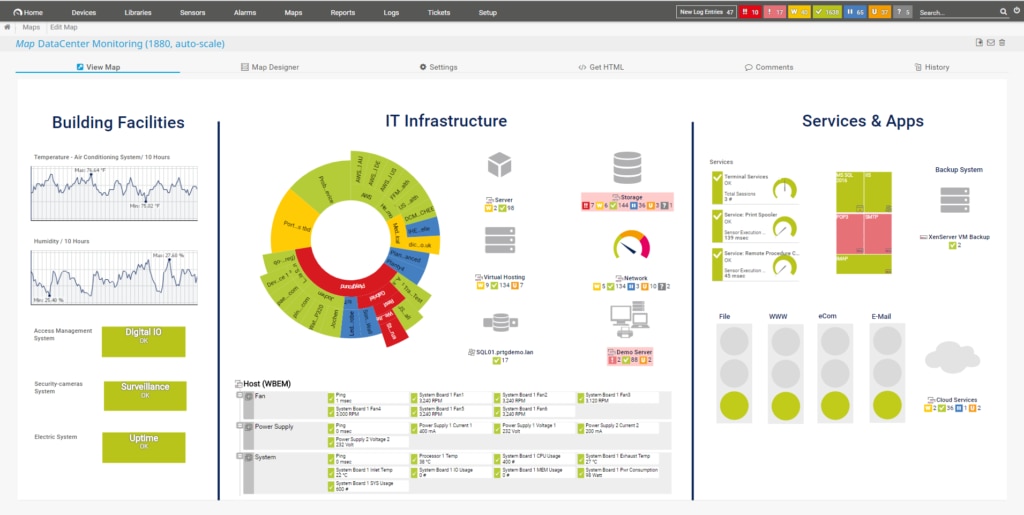
Another important feature of NPM is the network mapping tool, Network Atlas, which is similar to the free Spiceworks Network Mapping Tool. Network Atlas creates custom network maps in the SolarWinds Orion Platform, giving you a geographic representation of the network. Having links between the physical location and the various network devices streamlines monitoring. It also supports wireless mapping, so you’re not limited to local area networks (LANs).
The tool’s unique NetPath™ feature provides a visual representation of your network, both inside and outside your firewall. It shows an analysis of the performance across the network, helping you identify any failures or areas with slow performance and address them more quickly.
NPM has many other features, including:
- Integrate with help desk management software (unlike the Spiceworks network monitoring and help desk tools, which do not integrate)
- Options to monitor hardware, VMware, and Hyper-V (unlike currently offered Spiceworks tools)
- Ability to diagnose network issues (Spiceworks tools do not diagnose network issues)
SolarWinds Network Performance Monitor is installed on-premises, and you can give it a try with a 30-day free trial. After that, pricing is based on the number of elements you have.
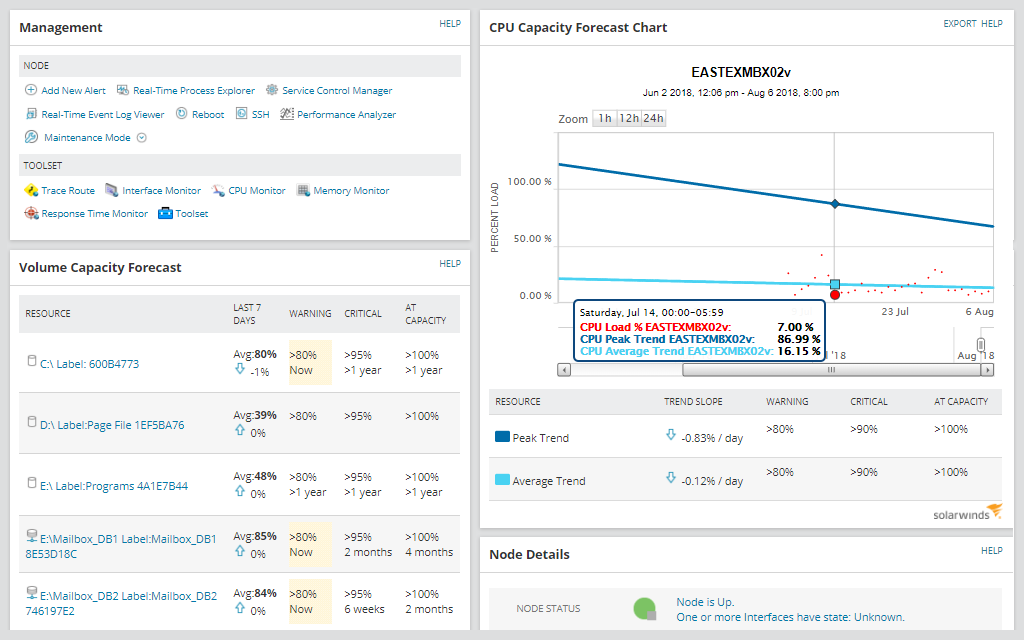
The next alternative to using the Spiceworks suite of IT management tools, including Connectivity Dashboard, is SolarWinds Server & Application Monitor (SAM), a comprehensive monitoring solution that includes IT asset management. Like SAM, Spiceworks functionality extends to monitoring servers, but unlike SAM, it does not extend to applications.
Part of SAM monitoring goes toward tracking server resources. SAM provides visibility into:
- Earlier baseline information to give you clarity about expected and normal resource usage
- Capacity usage over time, for both peak and average capacity, to identify when you’ll need to invest in more resources
- Disk capacity in storage volumes
- Physical and virtual memory
- High CPU utilization
With this information, you can plan to stay within your resources or scale up as needed. Unlike SAM, Spiceworks Connectivity Dashboard isn’t based around baselines and metrics — instead, it’s designed to offer insight into whether devices are online and available.
SolarWinds monitoring covers Windows performance, and associates performance issues with the related physical and virtual infrastructure. Monitoring templates provide best practices for identifying any problems, and the results are presented in real time, so your team can move quickly on troubleshooting.
Unlike Spiceworks tools, SAM can monitor third-party applications, including Oracle, Linux, Solaris, and Citrix. It also covers Microsoft applications like SharePoint, Skype for Business, SQL Server, and Exchange Server. Having a unified view of all the applications is a powerful tool in maintaining your network.
As with Spiceworks Connectivity Dashboard, customizable alerts notify you when something is wrong, so you can remotely address many issues, including:
- Monitoring expensive processes and killing them if needed
- Viewing event logs
- Stopping or restarting corrupt services
- Rebooting the server
SAM does more than monitor. It also includes asset inventory tools to automatically discover systems and applications on the network. Additionally, when scanning your environment, SAM gathers software and hardware details for all your devices, with information on installed software, drivers, network interfaces, and more. You’ll also receive alerts for any server failures. It provides more thorough information than what’s available through using Spiceworks Inventory tools.
SolarWinds Server & Application Monitor is an on-premises solution priced based on the number of nodes. You can start with a 30-day free trial.
Datadog is a cloud-based service with built-in integrations to provide infrastructure management and network monitoring. It can monitor several targets, but the primary focus is on cloud services. This includes support for common web services such as AWS, Microsoft Azure, and Google Cloud. Datadog can also monitor both Linux and Windows virtual machines, as well as standalone servers.
The solution provides different ways to configure alerts based on your needs. You can set up alerts for a single device or a group of devices, and alerts based on thresholds. Datadog supports integration with third-party tools such as Slack and PagerDuty to deliver the alerts.
While Datadog doesn’t offer conventional reporting, you can access historical reports with the notebooks feature. You also have access to other analytical data and can search using different criteria, including event priority, status, or tag. You can save the queries to use again later.
The dashboard functionality goes beyond a simple display of real-time status and graphs. Datadog’s two dashboard types provide flexibility in monitoring:
- Timeboards are designed for troubleshooting by providing time-synchronized metrics, giving insight into how events on different systems might be correlated.
- Screenboards show the current status and performance metrics, which can be shared with a public URL.
Two of the Datadog solution’s biggest strengths are the options for integration and customization. With more than 200 integrations built in, you have significant flexibility to monitor and work with other services. This includes:
- Monitoring code changes
- Tracking administrative actions
- Viewing performance
- Improving communication
- Working with cloud services, enterprise apps, admin tools, and open-source software
Datadog has three pricing levels, including a free service. Although the free service only provides one day of retention and no alerts, it can still be a good evaluation option to decide whether to move on to one of the higher levels, which are charged per month, per host.
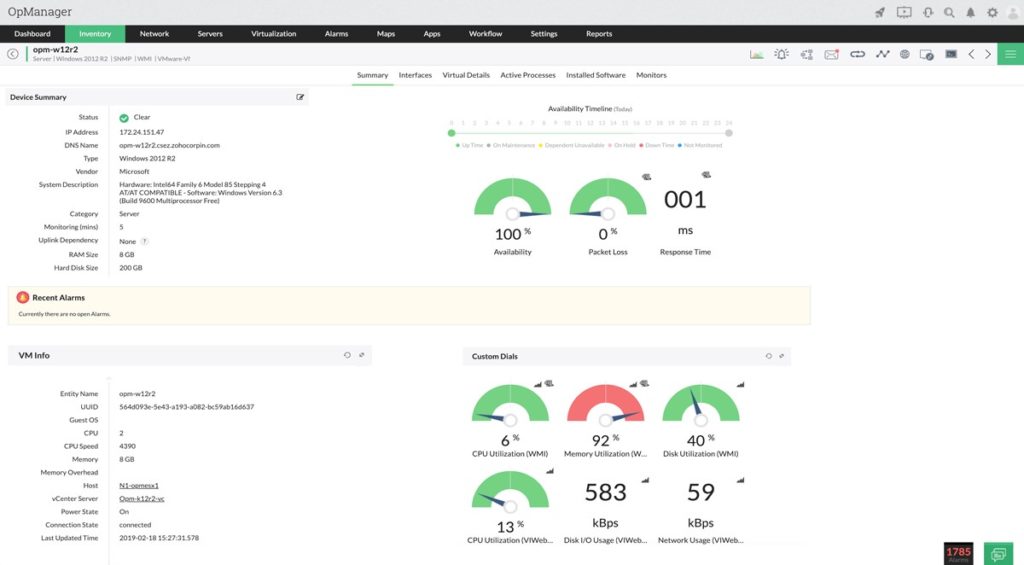
Another Spiceworks alternative to consider is OpManager from ManageEngine. This network management solution provides in-depth visibility into the devices connected to the network, from printers to routers to LAN controllers.
From a monitoring perspective, you have several options. You can review the performance of physical servers, either Windows or Linux, by looking at the memory, CPU, and disk utilization. You’re not limited to physical devices, though: OpManager also provides visibility into virtual servers and platforms, including VMware, Hyper-V, and Xen.
Along with monitoring storage devices and utilization capacity, OpManager provides a forecasting feature. This gives you valuable information about when you might need to increase capacity.
One important benefit of using OpManager comes in the form of deep packet inspection support. This gives you oversight of all application traffic, enabling you to review any delivery problems and manage the traffic flows to improve performance.
You can also configure alerts with multiple thresholds to ensure you receive a notification for each performance monitor. With the mobile app, you can receive alerts on your mobile device to continually keep track of performance.
Additionally, OpManager supports workflows, which allow you to streamline and automate repetitive tasks and troubleshooting. Workflows can be used to:
- Identify the most recent changes on a network device
- Stop/restart a process or service automatically
- Run identified scripts and review the output
- Suspend, restart, and/or shut down a virtual machine
To review all the information, you can use provided dashboards or create your own, using over 200 performance widgets.
Overall, OpManager is very user-friendly. It’s easy to set up and use, and it offers free training sessions and demos. ManageEngine offers three levels of the software, with pricing based on features and number of devices.
Paessler PRTG is a monitoring solution designed to show real-time information on the entire network and provide a way to manage your devices. Like Spiceworks, this functionality comes with an easy-to-use interface.
For companies with a distributed team, PRTG offers many benefits. With the hosted version, remote probes allow you to monitor your LAN. These remote probes also enable you to distribute the monitoring load. You don’t need to worry about the size of your network, because your PRTG license gives you access to an unlimited number of probes.
Another feature is failover-tolerant cluster monitoring. This allows you to have a cluster where if the master node fails, another node takes over until the master node is available again.
You also have plenty of options when it comes to alerts. PRTG offers built-in options for 10 technologies, including email, HTTP requests, and audio files, to indicate an alarm. Depending on your version, you can also receive text messages.
Alerts are configurable, allowing you to schedule when you want to receive alerts of different priorities (e.g., receiving only high-priority alerts at night). If the provided notifications aren’t flexible enough, you can write your own with the PRTG application program interface.
PRTG provides a map designer for you to create dashboards, giving you visibility into your network maps with real-time status information. The map designer provides over 300 map objects for you to choose from, and you can share your maps using a unique URL.
Additional analysis is available with reports. You can run these when you need them or schedule them to run on a regular basis. The reports give you all the statistics, graphs, and numbers for the data you monitor, and you can export the information into other formats, such as CSV or PDF files, for further review. This analysis includes a bandwidth review, so you can identify any bottlenecks and address them to improve performance.
PRTG offers an on-premises solution with several levels, with pricing based on the number of sensors you need and the number of servers you’ll be monitoring. All functionality is available no matter the level you choose. For large enterprises, PRTG also offers a subscription option for scalability.
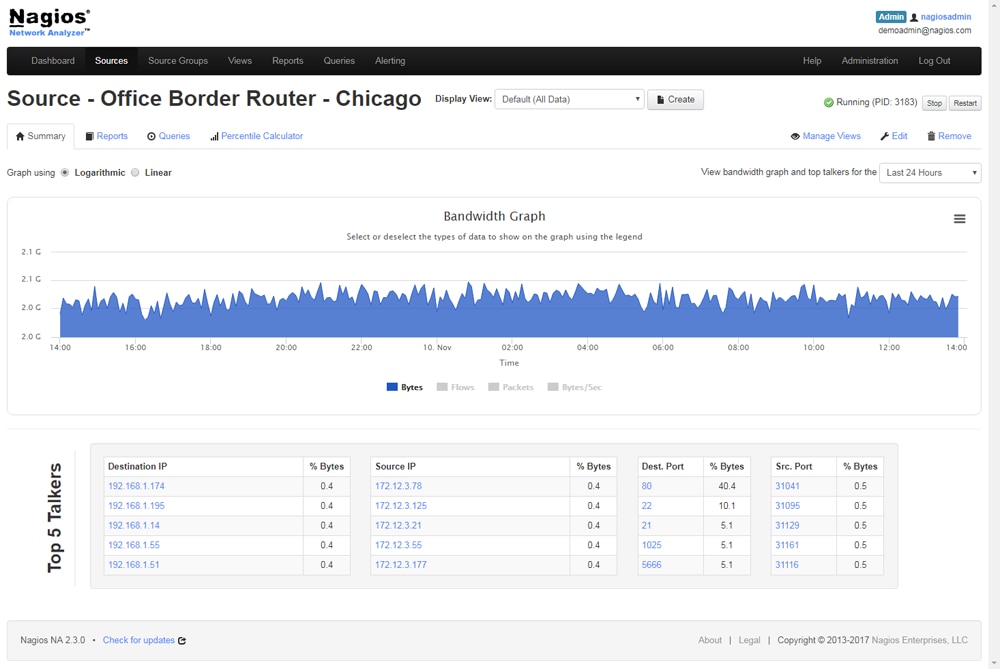
Another network monitoring tool is Nagios Network Analyzer, which gives a view of all network traffic, including bandwidth issues and possible security threats.
Network Analyzer has a user-friendly and intuitive interface, making it easy to review the network traffic. Using wizards, you can set up alerts to notify you of bandwidth problems or other concerning activity, allowing IT to address issues as soon as they come up. You can also easily add new sources you want to monitor.
Network Analyzer undertakes an extensive review of your network to provide you with clarity on network health and presents the information in a comprehensive dashboard. At a glance, you have visibility into critical server metrics, network flow data, and more.
If you need to see more detailed information on a specific source, port, or individual IP, you can easily drill down. This includes getting access to granular data, even down to the packet, which can then be stored and referenced for future analysis and tracking.
You can also customize the solution to meet your needs. Administrators can organize similar sources and apply views to multiple sources as needed, all built on your specifications.
Additionally, a bandwidth utilization calculator is available and can be customized to create reports on different views of utilization. This includes summarizing bandwidth use by IP, source, or other combinations.
When reviewing data, you have the option to track subsets of information from the network flow. A history of network flow data is also retained for reference.
Network Analyzer is an on-premises solution, with pricing based on the number of licenses. It can also be bundled with other Nagios modules.
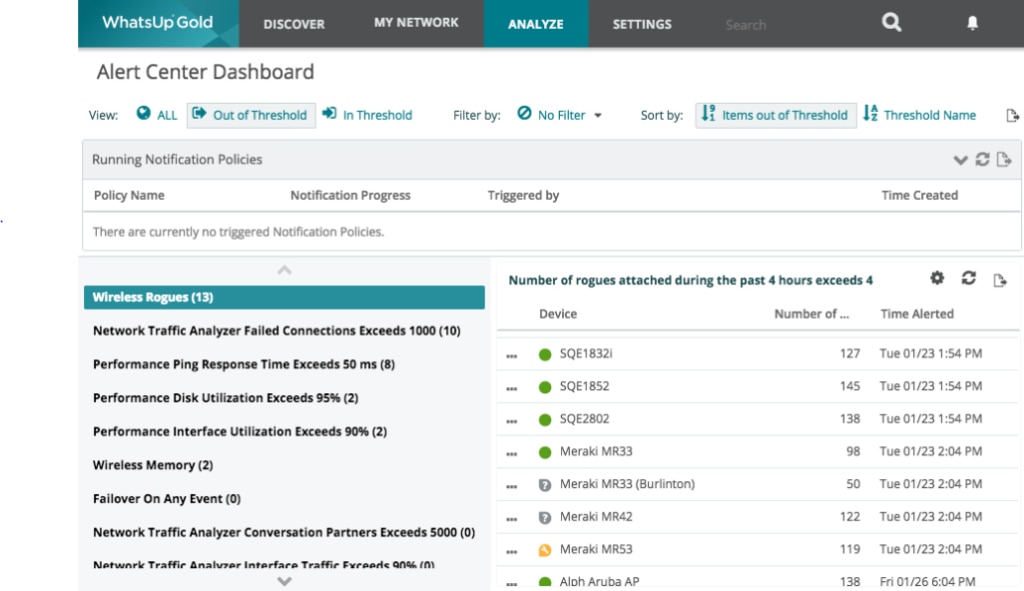
Ipswitch WhatsUp Gold is another tool for monitoring as well as network discovery and mapping. It provides different kinds of monitors to keep you ahead of performance issues. These include:
- Active monitors to poll devices for yes/no or up/down responses
- Passive monitors to identify information from networked devices and servers, including SNMP traps, syslog, and Windows Event Logs
- Performance monitors to track CPU, memory, disk, and network utilization with SNMP, WMI, or SSH
Additionally, cloud monitoring dashboards give you visibility into resource usage and billing, which helps in compiling a cost analysis and justification. This includes mapping and monitoring cloud environments such as AWS and Azure servers.
For any problems found during monitoring, you can customize alerts. These can come in via email, SMS, Slack, web alarms, IFTTT posts, and service restarts.
Another benefit of WhatsUp Gold is the ability to see your network map in context. As part of monitoring, the tool maps your network, including servers, virtual machines, and other devices in cloud and wireless environments. Once everything is mapped, you can click on a listed device to see related network settings and reports.
The dashboard and report functionality is also robust. These features include:
- Overview dashboard showing up or down status
- One-click ability to sort, add, or remove columns
- Ability to apply filters to multiple reports with “pins”
- Filtering by time frame or business hours
- Report scheduling and email distribution
- Exportability to multiple formats
You can also easily integrate the program with other applications with a REST API. This allows you to extract data from WhatsUp Gold for use in another system, or to bring in information from an outside system for reference. You can then use the information to automate parts of your workload.
WhatsUp Gold has three pricing options, one offered as a subscription and two with a perpetual license. Each of the levels has different functionality.
Microsoft System Center is a cloud solution for unified management across client environments and platforms. It supports monitoring for more than Windows servers: you can monitor across platforms, including Unix, Linux, Solaris, HP-UX, and IBM AIX environments. Microsoft Service Center also supports users on mobile devices such as iOS, Android, Symbian, and Windows Phone 7.
Having a unified view of information, regardless of platform, simplifies data center management. This improves operations across the company for all data-related functions while maintaining fast performance.
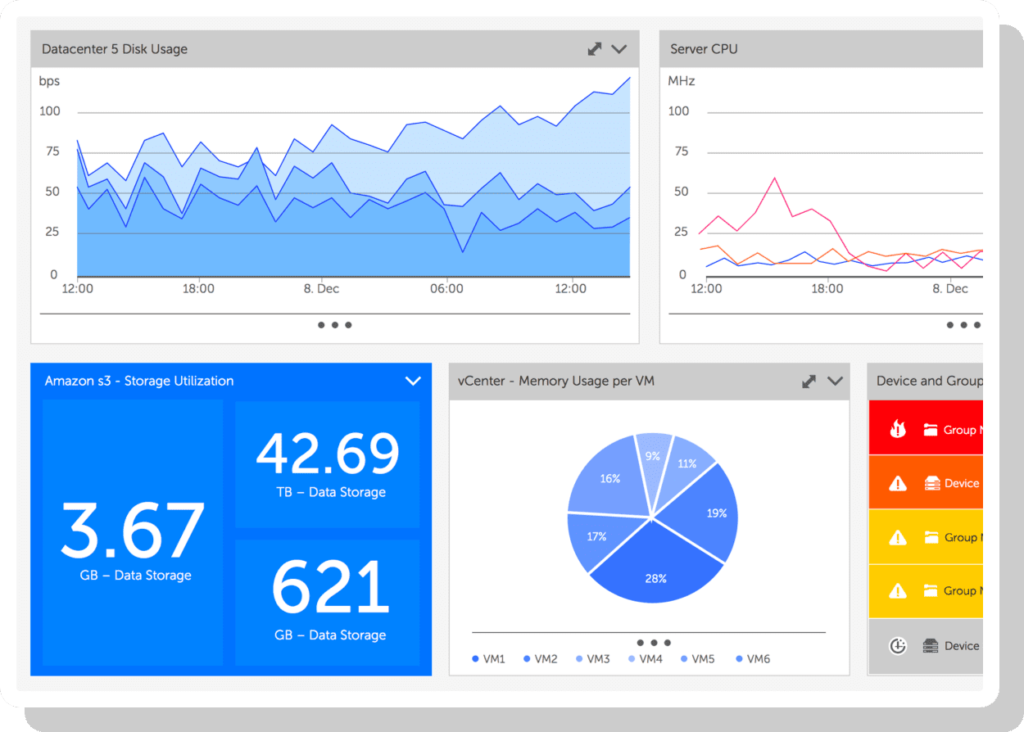
A central dashboard offers an intuitive overview of the network, including information about:
- Health and availability of resources
- Network health
- Performance of hosts, virtual machines, and more
- Alerts
From the dashboard, you can also drill down or up to change the layouts.
Since this solution is built with a data protection manager, it helps users back up their files and recover lost data. It also comes with endpoint protection, which minimizes threats from outside agents trying to gain access to the network.
Microsoft System Center improves efficiency with automated workflows, and it offers self-service options through the web portal.
The solution has two versions available: the Datacenter Edition, for virtual servers, and the Standard Edition, for physical servers.
LogicMonitor is a cloud-based monitoring solution offering visibility into hybrid infrastructures and providing actionable insights. It has more than 1,000 pre-built monitoring templates, supporting a wide array of discovery, monitoring, and alerting tools.
While monitoring, the solution measures website performance and availability, then provides visibility into all the components of hybrid environments. This includes showing cloud availability and performance plus any on-premises components. This information allows you to make sure your users have access to necessary websites and applications, no matter their location.
As part of tracking performance, LogicMonitor also looks at patterns and detects abnormalities. By catching these performance problems early, you can prevent them from becoming significant enough to cause downtime.
The solution has alerts preconfigured based on best practices, but you can easily configure them to be more specific to your business needs. Once generated, alerts can be set up to go to different teams based on different parameters: severity, technology, time of day, and more.
IT agents can receive those alerts in several ways, including through communication tools like Slack and service management tools such as Autotask. Agents can perform different functions when responding to the alerts, such as escalating or acknowledging the issue, or scheduling downtime.
Alerts are also visible as part of the topology map for your infrastructure, which streamlines troubleshooting. In addition, the topology map allows you to navigate your resources based on their relationship. You can save the maps you use regularly.
Configurable dashboards provide meaningful displays of the data, with graphs, tables, charts, and more. The dashboards are scalable as you add devices, and you can combine data from multiple areas of your infrastructure. You can also report on the data: standard reports give you a starting point, but you can customize them and set up a delivery schedule to meet your business needs.
LogicMonitor offers two versions of its core package, based on functionality and number of devices, and volume pricing is available.
Best Spiceworks Competitors
The multiple tools that make up Spiceworks IT management offerings have their uses, but if you’re looking for functionality beyond what’s available with an array of free tools, consider one of the Spiceworks competitors. When deciding, consider the kind of network you have, the types of monitoring and alerts you want, and how you want to see data presented.
If you want advanced network performance monitoring for cloud, hybrid, or on-premises solutions, SolarWinds Network Performance Monitor is a great option. If you’re looking for a tool with IT asset management as well, consider SolarWinds Server & Application Monitor. These and the other alternatives in this guide are viable options, depending on your business needs, and offer additional benefits over Spiceworks to provide a more complete solution.
*As of February 2020