
The performance of your web applications, network, and server can have a significant impact on your revenue, brand reputation, and credibility in the digital world. While some organizations may still prefer to monitor performance the old-fashioned way with a manual approach, this can become increasingly difficult as your business grows. As an alternative, many businesses are choosing to use automated tools designed to provide them with effortless and detailed insight into the performance of their critical business components, often in real time.
New Relic One is a popular performance monitoring tool capable of providing you with a flexible and dynamic approach to monitoring. Although generally considered to be effective, some may feel it’s not cost-effective for small- to mid-size businesses and comes with a steep learning curve. If you want a tool you can get started with quickly, requiring minimal training or experience, New Relic may not be for you.
For those in search of a New Relic replacement, this guide reviews some of the best New Relic competitors on the market today. My top pick is SolarWinds® Server & Application Monitor, followed by SolarWinds Network Performance Monitor. These are similar tools to New Relic because they offer a similar range of sophisticated capabilities, but they’re designed to be affordable, work out-of-the-box, and exclude the initial learning curve. Read on to find out how these and other New Relic alternatives compare.
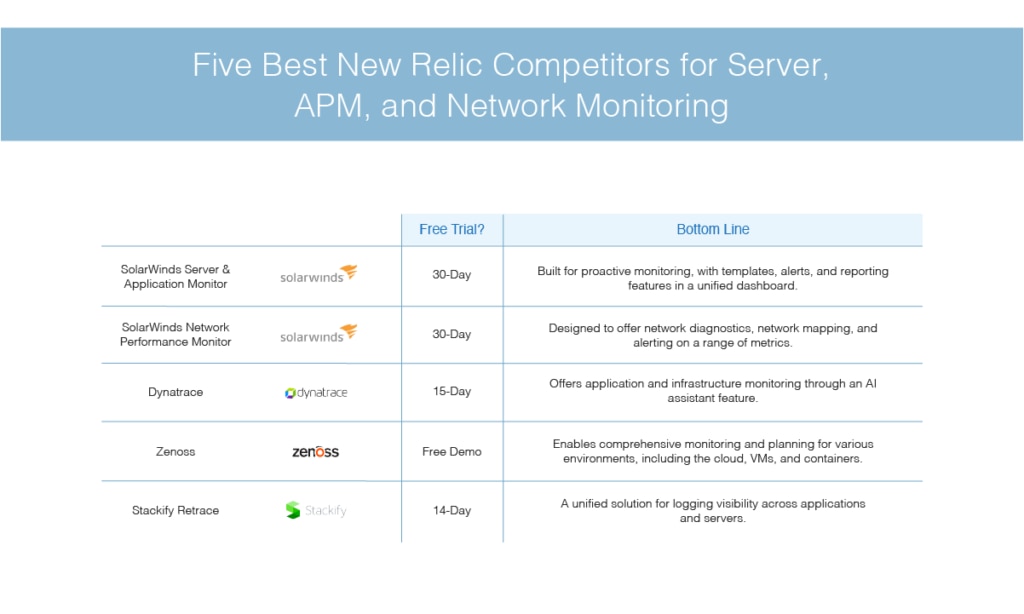
Top New Relic Alternatives
- SolarWinds Server & Application Monitor
- SolarWinds Network Performance Monitor
- Dynatrace
- Zenoss
- Stackify Retrace
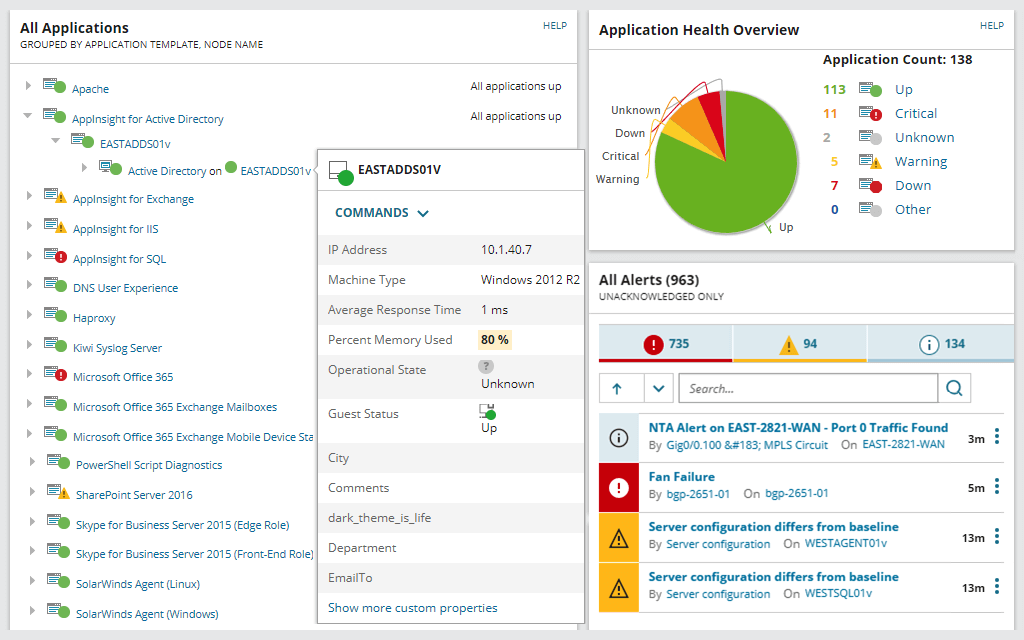
SolarWinds Server & Application Monitor, often called SAM, is popular among New Relic server monitoring alternatives and New Relic APM alternatives. In addition, it stands out as a New Relic Infrastructure alternative.
Like New Relic, SolarWinds SAM delivers application performance monitoring for a wide range of applications and systems. Its monitoring templates are built to cover private, public, and hybrid cloud environments, allowing for Azure performance monitoring, AWS cloud monitoring, Microsoft monitoring, Apache server monitoring, and more. New Relic also provides a unified tool for multiple languages and environments.
As a New Relic server monitoring alternative, SAM allows you to replace multiple vendor monitoring systems by providing you with access to comprehensive insights into availability and performance. Like New Relic, this tool delivers monitoring, alerting, and reporting capabilities for multi-vendor server hardware monitoring—all within a single console.
While New Relic uses agents, SAM is an agentless server monitoring software designed to leverage best practice thresholds for key server health monitoring metrics. This includes array status, fan status, fan speed, CPU, temperature status, hard drive status, and much more. SAM tracks these metrics for a range of servers—including HP ProLiant, Dell PowerEdge, and IBM eServer xSeries servers—allowing you to get ahead of availability problems. New Relic also allows you to track a range of set and custom metrics.
SAM uses proactive monitoring to help you solve issues before they impact your users. Similar to New Relic, it’s able to display real-time and historical trends. The scope of functionality in SAM can also help you proactively address issues and manage capacity at the application layer. I believe these features place SAM among the top New Relic Synthetics (a tool for synthetic monitoring) alternatives, and the top New Relic APM competitors.
One of the most advanced features in SAM is the Real-Time Process Explorer (RTPE). With RTPE, there’s no need to manually log in to each machine, either physically or remotely, and run Task Manager to access vital metrics. Instead, you can take advantage of the web console to display data for both monitored and unmonitored processes. You’re afforded a central view, which helps to resolve issues as quickly as possible. The web console includes integrated server monitoring tools, so you can natively start and stop services, kill rogue processes, and reboot servers. New Relic also offers some real-time streaming features for dashboard visibility, but I don’t find it provides the same level of centralized control for my needs.
SAM dashboards are built to be intuitive and easy to navigate. The layout is clear, and data is represented graphically where possible for ease of interpretation. SAM allows you to filter summary views in your dashboard by application and/or server. You can even create custom dashboards displaying the servers, applications, and nodes you want to keep your eye on. Dashboards can be organized to suit your needs and the needs of individual teams. New Relic also offers customizable and highly visual dashboards with the ability to filter.
As a New Relic replacement, SAM lets you create monitors for custom applications, on-premises and in the cloud, with out-of-the-box support for multi-vendor applications. As with New Relic, you can use scripts, APIs, and PowerShell to extend monitoring and reporting capabilities via third-party vendors.
Server & Application Monitor is well known for its user-friendliness and offers an impressive range of advanced features. SolarWinds also has an active forum of loyal users that can be a good resource. Also, customers with active maintenance can receive 24/7 support technician availability. New Relic offers customer support as well.
You can access a 30-day free trial here.
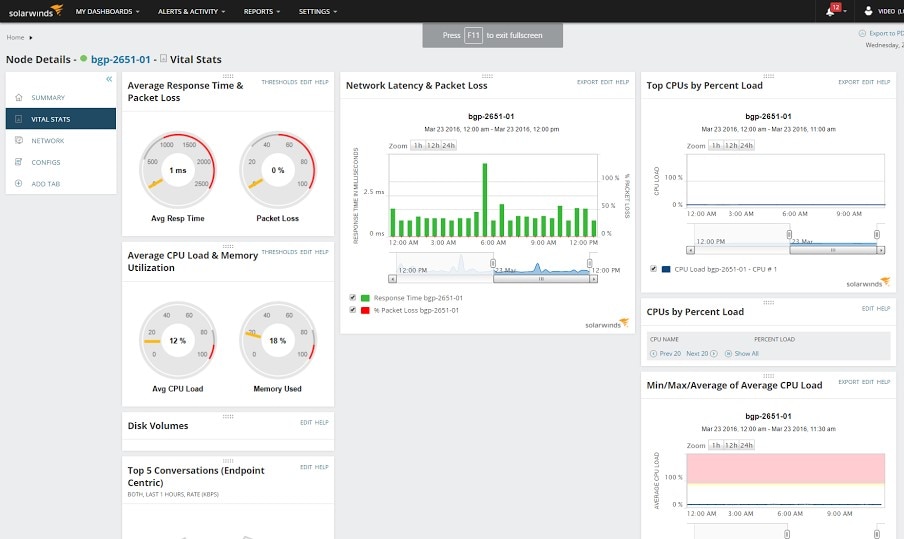
SolarWinds Network Performance Monitor (NPM) delivers multi-vendor network monitoring designed to scale and expand according to the needs of your network. This is extremely versatile and widely used software for those looking for tools like New Relic.
NPM offers network availability monitoring capabilities, helping you get to the root of network availability, fault, and performance issues. It includes network diagnostics utilities to monitor the performance and availability of network devices on a continuous basis. This feature, combined with intelligent network alerting, keeps you informed of all key performance metrics. NPM comes with predefined thresholds, which you can alter to suit your needs.
I feel NPM provides more focus on monitoring network hardware vs. New Relic, as NPM is specifically designed to integrate with a wide range of network hosts like servers, routers, firewalls, or switches. However, New Relic does include custom metrics and threshold-based alerts.
As a network diagnostics tool, NPM can track and display current and historical performance metrics similar to New Relic capabilities in the form of customizable charts and dashboards. Network Performance Monitor also allows you to monitor interfaces to determine whether an issue is caused by downtime, flapping routes, or hardware health, which can help speed up the process of resolving network connectivity issues.
One of the reasons NPM stands out among New Relic alternatives is it helps you pinpoint whether an issue is being caused by an application or by the network. It uses packet analysis to help you determine what’s causing a poor user experience, so you can accelerate your time to resolution. New Relic isn’t designed around packet analysis.
NPM features NetPath™, a visual traceroute utility allowing you to see into your critical network paths, gaining deeper insights and improving your time to resolution. With this feature, you can see devices, networks, applications, and vendors in a single-page path analysis. This means every hop is tracked, and you can view latency either historically or in real time. These visual analysis and problem-solving capabilities are ideal for hybrid IT environments. While New Relic allows for ping monitors, it doesn’t offer a similar visual traceroute tool.
NetPath guides you in isolating network slowdowns and identifying the person you need to contact to rectify the issue. With visibility into the entire network path, you can gain a comprehensive understanding of your provider’s network. To boost quality of service for end users, NetPath measures performance characteristics for each network node and link, making detecting slowdowns much easier. New Relic does provide similar insight for faster diagnosis of application and network issues.
SolarWinds NPM is a highly visual tool, which contributes to its overall user-friendliness. It even features a network mapping utility allowing you to create custom maps, visual packet paths, and wireless heatmaps. You can drag and drop network devices, servers, and wireless access points onto custom or default background images. This includes dynamic backgrounds like weather maps. New Relic also provides customizable visualizations of your architecture, including dependencies.
The alerting capabilities in NPM are an especially welcome feature and have been cleverly designed to avoid flooding users with notifications. You can use or modify built-in default alerts or set precise custom alerts according to your specific needs, reducing the number of unnecessary or irrelevant alerts in your inbox. You’re also able to create notifications both dependency- and topology-aware. With web-based network notification software, NPM can allow you to easily create alerts based on complex or simple nested trigger conditions, network topology, and defined parent/child dependencies. New Relic also offers these kinds of customization options.
This New Relic competitor combines an intuitive user interface and easy-to-use dashboards with a range of advanced features. It’s suitable for small and large companies alike, and has been designed to scale with you, making it cost-effective.
A 30-day free trial is available.
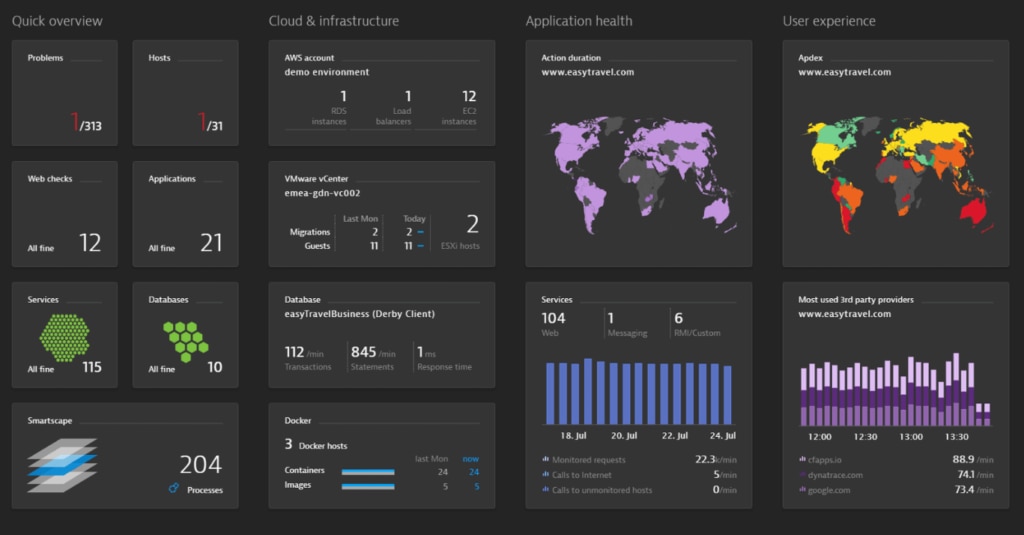
Dynatrace is another well-known New Relic competitor, offering both application performance and infrastructure monitoring. This tool delivers all-in-one, advanced observability backed by AI assistance. It helps teams automate their operations, saving them time and resources, and providing better business outcomes.
The Dynatrace AI assistant is called Davis, and it automatically processes billions of dependencies to facilitate precise metrics and answers. This is a dynamic piece of technology processing eight billion application changes every day. According to Dynatrace, Davis can be used to deliver a reduction in overall outage of approximately 100,000 minutes, significantly improving system health. Similarly, New Relic offers “Applied Intelligence” to help automate the problem-finding and resolution process.
Dynatrace provides users with access to an impressive number of automation capabilities. It includes a utility called OneAgent, which gathers high-fidelity data automatically and on a continuous basis. Data is gathered in context, with no need for manual configuration or scripting (New Relic AI also minimizes configuration needs). OneAgent discovers all the processes running on a host and automatically activates instrumentation for your stack. Any new components will be automatically instrumented as and when necessary.
Another powerful Dynatrace utility is Smartscape, which continuously and automatically maps data into a real-time dependency map similar to New Relic dependency maps. This map displays the relationships and dependencies for all entities, both up and down the stack, and horizontally between processes, hosts, and services.
The Dynatrace machine learning technology automatically learns what normal performance looks like, and dynamically adapts according to any changes within your environment. As with the New Relic feature, this tool proactively alerts you to any issues, while simultaneously reducing alert noise. It achieves this by determining the severity of an incident, based on business and user impact, so your team can prioritize what matters most in the moment.
One of the many reasons to like Dynatrace is it conducts automatic and accurate root-cause analysis, in addition to auto-remediation. Like the New Relic “incident context,” the Dynatrace AI gives you clear insight into how it reaches its conclusions. By integrating it with your configuration management database and continuous delivery tools, you can automate remediation for many issues.
While the Dynatrace automation capabilities are impressive, the tool would benefit from providing more detailed insight into specific metrics. As a New Relic APM alternative, however, this is a robust option. It delivers advanced observability across cloud and hybrid environments, from mainframe to microservices. It automates full-stack instrumentation, dependency mapping, and provides AI-assisted answers. Dynatrace APM includes infrastructure monitoring and AIOps, making it a versatile New Relic competitor.
A free trial of Dynatrace is available.
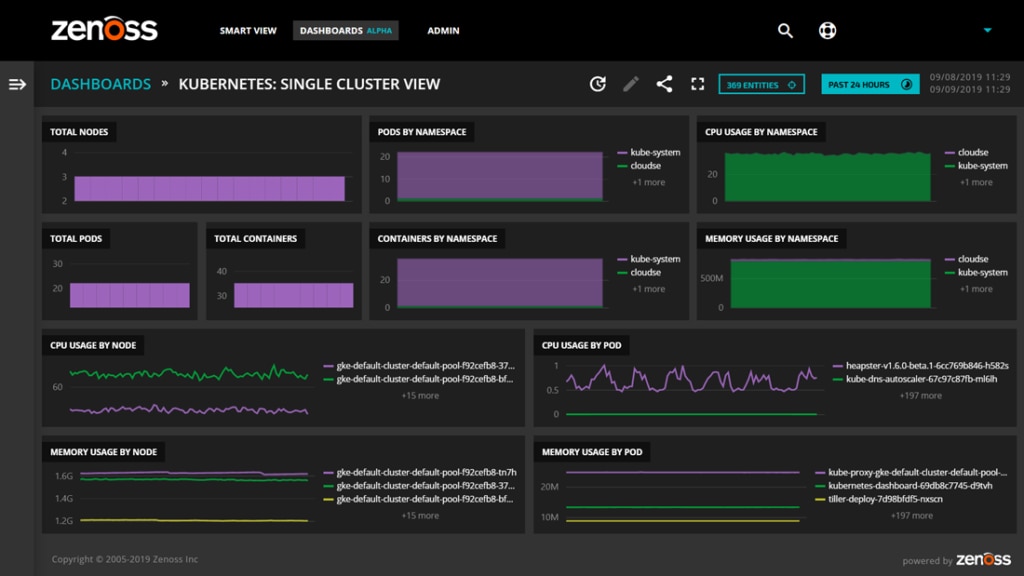
Like New Relic, Zenoss offers cloud monitoring, server monitoring, virtualization monitoring, container monitoring and microservices, storage monitoring, network monitoring, application monitoring, and more. It provides an alternative to the traditional approach to server monitoring, which involves separately monitoring silos of device types, like servers. With Zenoss, you can monitor your servers as part of a complete IT stack, which includes your on-premises and cloud infrastructure. This helps you deliver optimal application and server performance.
Zenoss combines operational insights from your virtual, cloud, and physical infrastructures to give you comprehensive insight into your entire ecosystem, at scale. Like New Relic, it automatically detects infrastructure issues impacting an application and displays how the affected component interacts with other system parts. This helps your IT team resolve problems and maintain continuous service delivery.
If capacity planning and resource management is a priority for you, then Zenoss is a good option. It gives you performance insights and lets you monitor devices at a component level. This includes monitoring performance and configuration data for different devices, helping you deliver service assurance. Like New Relic, Zenoss provides you with a real-time view of your infrastructure and gives you the tools necessary to proactively troubleshoot any unexpected issues before they impact your end users.
Zenoss gives you clear visibility into the performance, health, and use of critical systems your services depend on. With unified IT monitoring and analytics for the whole of your multi-vendor infrastructure, it’s easy to map the service impact relationships between application components and infrastructure. This helps improve the effectiveness of root-cause-analysis activities. New Relic provides similar dependency mapping options.
A great feature of Zenoss, as with New Relic, is it provides multi-platform support, helping eliminate the need for disparate monitoring tools for each individual platform. The tool’s unified approach offers the fastest route to issue identification, reducing your mean time to resolve (MTTR) value. This also helps eliminate the problem of different teams working with different data when attempting to resolve the same issue.
This is a comprehensive tool offering multiple monitoring solutions, including application, network, and server monitoring. However, the user interface could be easier to navigate and more user-friendly. Zenoss requires you to submit a request if you want access to their prices. You can do so, and request a demo, here.
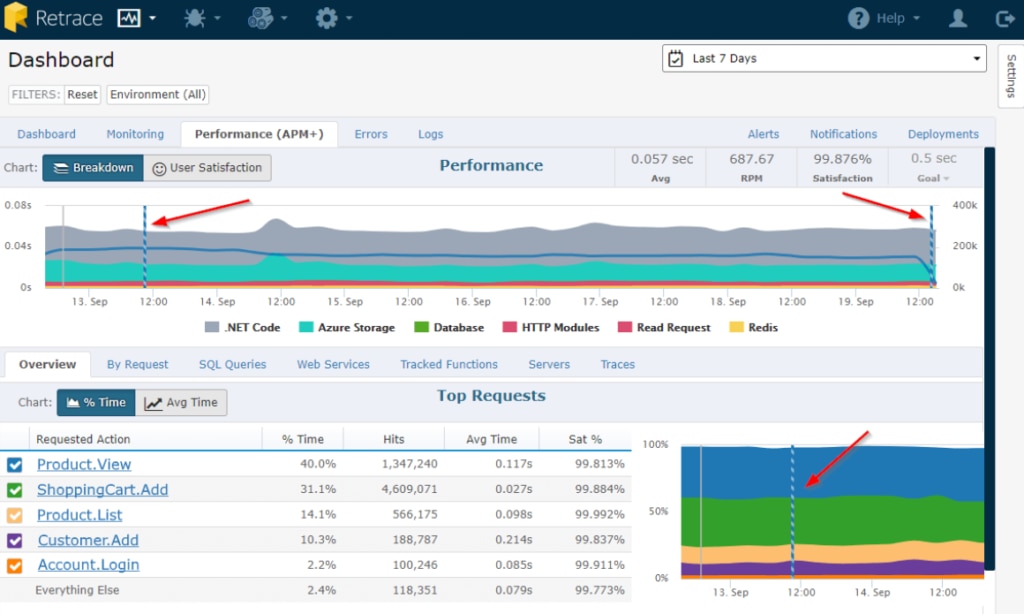
Stackify Retrace is a New Relic APM alternative delivering a range of application performance management and monitoring capabilities. This tool helps you rapidly identify which part of your stack is causing the bottleneck, so you can continuously improve application performance. Like New Relic, it lets you monitor Apdex user satisfaction, track deployments, identify slow dependencies, and gain detailed insights into the performance of your applications.
Like the New Relic Logs feature, this is a fully unified solution to aggregate your logs across applications and servers, giving you access to them in one place. You can view and search your application and server logs, go from a log statement to a full transaction trace, boost analysis efficiency with log tags and structured logging, and configure and monitor automated log queries.
Stackify Retrace also helps you find and resolve exceptions in your code, reducing time to resolution. To assist with this, you can view logs and exceptions side by side for comparison purposes, identify unique exceptions quickly and easily, monitor exception rates, and proactively identify application bugs. New Relic is also built for quick log searching and visibility.
Similar to the developer-friendly New Relic platform, Stackify Retrace lets you retrace your code with lightweight code profiling capabilities, giving developers code-level insights alongside integrated logging. Like New Relic transaction tracing tools, key capabilities of the Retrace code profiler include:
- Collecting frameworks and dependencies automatically
- Viewing detailed snapshots of what your code is doing
- Tracking SQL queries executed by your code
- Tracking usage and performance anywhere your code makes HTTP requests
- Profiling the performance of asynchronous code
This tool allows you to track and monitor key application and server metrics. You can create custom dashboards to suit your priorities, share individualized app dashboards with your entire team, and adjust settings to align dashboards with different objectives.
This is a powerful tool with lots of welcome features, but there’s a learning curve when you get started with Stackify Retrace. A 14-day free trial is available.
Choosing the Right New Relic Alternative
When it comes to ease of use, I would consider SolarWinds SAM and NPM a cut above New Relic. They offer maximum automation capabilities, making your job significantly less time-consuming. At the same time, these tools are advanced, giving you the best in server, application, and network monitoring. SAM, in particular, includes features designed to make it an optimal alternative not only to New Relic server monitoring but also to New Relic Infrastructure, Synthetics, and APM.
You can access a 30-day free trial for SAM here and a trial for NPM .
*As of May 27, 2020