This Wireshark tutorial will teach you everything you need to know about how to start using Wireshark to get the most out of your network. I’m going to cover this software from start to finish, all the way from downloading the application to accessing advanced features. You’ll learn the ins and outs of analyzing packets, using filters, and turning the information you get into usable data. Throughout the tutorial, I’ll work in some frequently asked questions and shortcuts to make navigating this software a breeze.
At the end of the tutorial, I’ll let you in on the secret to getting better data analysis from Wireshark. Hint: the secret to unlocking all the insights available from Wireshark is using it alongside a compatible network analysis tool, like my favorite, Network Performance Monitor.
What Is Wireshark?
How Does Wireshark Work?
Wireshark Download and Installation
How to Use Wireshark to Capture Packets
Troubleshooting With Packet Capture
How to Read Wireshark And Analyze Wireshark Capture Packets
How to Use Wireshark to Monitor Network Traffic
How to Use Filters in Wireshark
How to Color-Code in Wireshark
How to Use Wireshark to View Network Statistics
Advanced Wireshark Features
Getting the Most Out of Wireshark
Final Thoughts on Wireshark
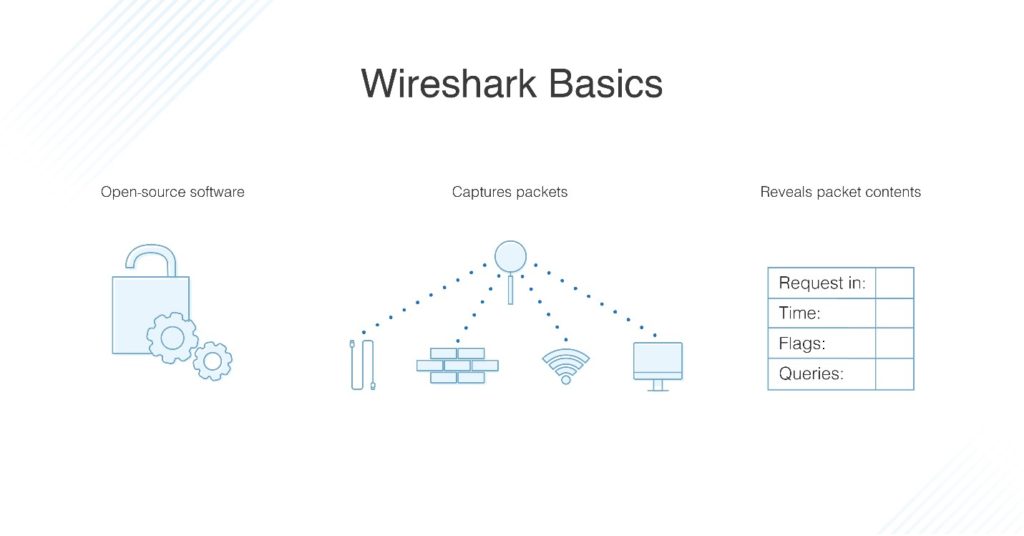
What Is Wireshark?
Wireshark, formerly known as Ethereal, is a popular network analysis tool to capture network packets and display them at a granular level. Once these packets are broken down, you can use them for real-time or offline analysis. This is great for users who want to generate statistics based on this data or change it into a handy graph. The interface is user-friendly and easy to use once you know the basics of capturing packets.
Wireshark is unique because it’s totally free and open source, making it not only one of the best packet analyzers out there, but also one of the most accessible. The free version you download of Wireshark is the full version—no demo versions with reduced functionality here.
What is Wireshark used for? It’s designed for anyone who needs to monitor their network activity, from home users to enterprise IT teams. A lot of monitoring software falls short when it comes to scalability, but the folks over at Wireshark have managed to come up with a program that doesn’t need a whole bunch of extra add-ons to get the bare minimum of functionality. In contrast, the additional tools I recommend below make a good thing better.
What makes Wireshark unique is also what makes it kind of problematic. Since Wireshark is totally open source, there’s no solid support structure. This means no tech support, no 1-800 number to call, no representative for you to speak with for immediate assistance. Instead, you must take to the forums, Q&As, tutorials, FAQs, and other online resources for help. This might not be an issue for the industrious home user who would prefer to solve their own problems, but employees in a large IT enterprise might not necessarily have the time to go on a fact-finding mission. There can also be legal issues around using open-source software for many companies.
Users should be aware that with the great freedom allowed by open-source software comes great responsibility. Still, it’s not a good enough reason to write Wireshark off entirely. It’s important to consider whether this tool can offer your network some benefits.
How Does Wireshark Work?
Think of network analysis like getting a peek inside the nuts and bolts of network infrastructure. A network analyzer has devices to measure what’s going on inside a system. Information you can see and visually represent is information you can use.
Wireshark has many uses depending on why you’re interested in monitoring packets. Most people use Wireshark to detect problems in their network and troubleshoot based on that, but developers, for instance, can use it to debug programs. Network security engineers can examine security issues, QA engineers verify network applications, and the plain old tech-savvy person can use Wireshark to learn network protocol internals.
Using Wireshark to view network traffic is great, but Wireshark cannot be used for intrusion detection purposes. It won’t alert you when something weird is going on or if someone is messing around in your network where they shouldn’t be. It will, however, show some you some key data and help you figure out what’s going on after the fact.
Since Wireshark is a measuring tool, it also won’t change things around on your network. It doesn’t send packets over the network or change the network. As monitoring software, Wireshark is built just to analyze and display metrics. Some of its most important capabilities include the following packet-related functions:
- Capture, search, save, export, import, and colorize live data packets
- Display packets with detailed information
- Open files with packing data in them, both those captured in Wireshark and from other similar programs
- Filter packets based on a variety of criteria
- Create statistics
Wireshark Download and Installation
First things first, download Wireshark. You can download it for free from the company website; you should choose the latest version for your platform from the “stable release” section. Windows, Mac, and Unix are the top three supported platforms. Note: if Wireshark runs out of memory, it will crash. So before getting started, ensure whatever system you install it on has lots of memory and disk space.
Install on Windows: After downloading, you’re ready to start setting up. Install WinPcap when you’re prompted because you won’t be able to capture live packet traffic without it. To install, click the Install WinPcap box and you’re off to the races.
Install on Mac: Prepare for some light coding. You’ll need an installer like exquartz to download Wireshark for Mac. After you’ve done that, open the Terminal and input the following command:
<%/Applications/Wireshark.app/Contents/Mac0S/Wireshark>.
When you’re done, wait for Wireshark to start.
Install on Unix: Installation on Unix is more involved than the other two platforms, so prepare for a little bit more coding. Before you start, you’ll need GTK+, the GIMP toolkit, and Glib. The last tool you’ll need is libpcap. Once you’ve downloaded and installed all the supporting software plus Wireshark, retrieve it from the tar file. Then change over to the Wireshark directory and input the following command to finish:
./configure
make
make install
If your computer installed TShark but not Wireshark, it’s because there are several distributions with separate Wireshark packages out there for GUI and non-GUI components. This may be the case for your system. Try looking for a separate package called “wireshark-qt” and install it.
How to Use Wireshark to Capture Packets
Learning how to use Wireshark to capture packets can be tricky for people who have never done it before, and there are three important preliminary steps.
- Make sure you have the right administrative privileges to execute a live capture for your network
- Pick the right network interface for capturing packet data
- Capture packet data from the right location within your network
Once you’ve checked off those boxes, you’re ready to start capturing packets. There are two Wireshark capturing modes: promiscuous and monitor. You’ll use promiscuous mode most often. It sets your network interface to capture all packets on the network segment it’s assigned to and details every packet it sees. Monitor mode is available for Unix/Linux systems only and sets up the wireless interface to capture all the traffic it can possibly receive. For the purposes of this Wireshark tutorial, I’ll stick to promiscuous mode and the general process of capturing packets.
When you first boot up Wireshark, you’ll see a welcome screen with a list of available network connections for your device, like Bluetooth, Wi-Fi, and Ethernet. Towards the right of each of these network options is a little EKG line representative of live traffic on the network.
To start capturing packets, simply click on the network you want to monitor and press START. You can also monitor multiple networks at the same time.
Some handy shortcuts
- Keyboard: Press CTRL + E
- Toolbar: Click the blue shark fin button on the left side of the Wireshark toolbar
- Coding: Input the following command line: <¢ wireshark -i eth0 —k>
You’re done! Already wondering how to read Wireshark capture packets? Since Wireshark breaks packets down into a readable format, you can do a bunch of other fun things with them, like apply filters and color-code them. More on that later. To stop capturing, hit CTRL + E on the keyboard again or click on the STOP button next to the shark fin in the toolbar.
If you want a bird’s-eye view of your network’s packet transfer, you’ll need to switch to promiscuous mode. When your network isn’t in this mode, you only get a small snapshot of your network instead of the whole thing, which makes it harder to conduct quality analysis.
To turn on promiscuous mode, click on the CAPTURE OPTIONS dialog box and select it from the options. If everything goes according to plan, you’ll now see all the network traffic in your network. However, many network interfaces aren’t receptive to promiscuous mode, so don’t be alarmed if it doesn’t work for you. Check the Wireshark website for more information about software compatibility.
If you’re using Wireshark on Windows, you’re in luck because you can easily use Device Manager to see if your settings are configured to reject promiscuous mode. Click on the network and make sure the promiscuous mode settings are set to ALLOW ALL. Promiscuous mode enables lots of Wireshark’s functions, so you should do all you can to make sure your interface can use it, if possible.
If you want to practice capturing network traffic with Wireshark, you can use “sample captures,” which show you another network’s packet data. You can download sample captures from the Wireshark wiki website.
Troubleshooting With Packet Capture
Understandably, users have questions about how to capture Wireshark network traffic and how to read Wireshark capture packets since that’s the product’s main purpose. For the sake of time and space, I won’t get into every single frequently asked question under the sun, but I’ll try to address a couple of common issues with packet capture for Mac, Windows, and Unix. If you want to know everything and anything, head on over to the FAQ section of the Wireshark website.
Help, I’m not seeing any traffic when I try to capture traffic!
The Wireshark experts recommend asking yourself these questions: “Is the machine running Wireshark sending out any traffic on the network interface on which you’re capturing, or receiving any traffic on the network, or is there any broadcast traffic on the network or multicast traffic to a multicast group to which the machine running Wireshark belongs?”
If the answer to all these questions is no, your system might not be running in promiscuous mode. Make sure you have it turned on if your network can accommodate it.
Help, I’m only seeing packets going to and coming from my system instead of entire traffic!
It could be because the interface on which you’re capturing is using an Ethernet or Token Ring switch connection, meaning only broadcast and multicast traffic will be recorded. If this isn’t the case, once again, it could be because your system isn’t in promiscuous mode.
Help, I’m running Wireshark on Windows but I’m not seeing traffic sent by the machine!
If you’re using VPN client software, this might be the culprit. A lot of Wireshark users have reported this problem if they have Check Point VPN software on their system. If you remove it, you should be good to go.
Help, Wireshark is telling me there’s no interface found!
This is a big one. If Wireshark can’t find any networks attached to the computer it’s running from, you’ll be a “no interface found” error message. This is a big problem, obviously, because you can’t capture packets without a network. The interface error could be due to restrictive access permissions, firewall errors, or network card errors.
Wireshark needs access to the entire network, not just administrator privileges on Windows, so any access permissions problem would be rooted in WinPcap. Make sure you installed this properly during setup. On a Linux system, Wireshark runs programs with superuser privileges and needs to be run on the sudo command.
On Linux, Wireshark doesn’t have to be run as root but dumpcap does, and this might be causing the issue. Start by running the following command to dig into this module and get it configured properly. Not every Linux system is built the same way, so don’t be discouraged if setting dumpcap as root doesn’t work for you.
dumpcap setuid root
Didn’t work? Try this backup command:
setcap ‘CAP_NET_RAW+eip CAP_NET_ADMIN+eip’ /usr/sbin/dumpcap
How about now? If you’re still encountering issues, the Wireshark code might be in the bin directory when it should be in sbin. Try this if you get an error bounce-back:
setcap ‘CAP_NET_RAW+eip CAP_NET_ADMIN+eip’ /usr/bin/dumpcap
From there, try:
chown root /usr/sbin/dumpcap
chmod u+s /usr/sbin/dumpcap
If Wireshark is still in bin instead of sbin, switch “/usr/sbin/” to “/usr/bin/” in the code fabric. This troubleshooting sequence is long, but it covers all your bases. If you’re still having problems, it might be time to take to the blogs and find out what remedies other people have tried and tested.
Theoretically, your firewall shouldn’t be blocking Wireshark’s activity, but it’s not beyond the scope of possibilities. To test, shut down Wireshark, turn off your firewall, then turn Wireshark back on and see if it can find your network now. If it turns out your firewall was the problem, set Wireshark as an exception to your firewall rules.
Finally, if all else fails, you need to check your network card. This is a bit of a long shot because if there’s a problem with your network and Wireshark can’t get through, then nothing should be getting through. Still, check it just in case.
How to Read Wireshark and Analyze Wireshark Capture Packets
Once you’ve finished capturing packets, it’s time to look at them. Wireshark divides the view into three panes: packet list, packet details, and packet bytes.
The packet list section, at the top of the window, lists all the packets from the capture file. You can browse through each of the following data points:
- Time: timestamp for exactly when the packet was captured
- Source: the IP address where the packet originated
- Destination: the address where the packet is being directed
- Protocol: the packet’s protocol name
- Length: the packet length, in bytes
- Info: any additional details
The packet details section holds the protocols and protocol fields of the selected packet in collapsible form. Packet bytes, at the bottom of the page, shows the internal data for the selected packet. By default, this info is presented in hexadecimal format, but if you want to change it to bit format, you can right-click on the pane and select this option from the menu.
For the visual learners out there, you can use Wireshark to view network traffic in an IO graph. Just click on the STATISTICS menu and choose IO GRAPHS. You can set up the graph with whatever settings you want depending on the data you want to display. Only one graph is automatically enabled, so if you want to make more, you have to click on them manually. To add a display filter to the graph, click the filter icon on the graph you want to work with. Finally, use the style column to change what kind of graph you use to display your packet data—line, FBar, dot, or Impulse.
How to Use Wireshark to Monitor Network Traffic
Now you know how to capture and analyze packets, but how do you use Wireshark to monitor network traffic? Overall, you want to take the packets captured in Wireshark and break them down into different forms. Once you have those forms, you’ll be able to see what’s going on within your network.
Think of the network monitoring process like coloring paint by numbers picture. The outline of the big picture is already there, and you have a rough idea of what the picture will look like when it’s finished. To bring it to life, you have to start coloring bit by bit; only then does the vision become clear. In other words, conceptualizing a huge amount of data is easier when you break it down using certain factors and then build it back up.
To help users quickly and easily understand the data coming in, Wireshark uses filters, color coding, and network statistics to take stock of network data. Before you start in on any of these options, make sure active traffic is at a minimum. Close all active applications running on your network; this will make it easier to see your network at a glance. However, since you can’t literally shut down everything, expect to see a reasonable mass of packets being sent back and forth.
How to Use Filters in Wireshark
Filters are especially crucial when analyzing big files. When your connection is up and running, thousands of packets travel through your network every second. Filtering out all the information you don’t need at a particular moment is the first step to getting a clear picture of your network.
Lots of embedded features are available on Wireshark, but you’ll use Capture and Display most often. Capture Filters filter packets by reducing the size of incoming packet capture, essentially blocking some out while taking others. Remember, Capture Filters can’t be modified once capture has started, and once they’re set, they’ll apply to packets as soon as you start monitoring network traffic.
Display Filters, on the other hand, can be used to filter already recorded data. Display Filters determine the data you see when looking through previously recorded factors.
To look through one of the existing filters, search its name in the APPLY A DISPLAY FILTER field underneath the Wireshark toolbar or ENTER A CAPTURE FILTER field in the center of the Welcome screen. You can also choose a filter by clicking on the bookmark icon on the left side of the entry field. A menu will pop up with a list of the most commonly used filters for you to choose from, as well as an option to manage both Capture and Display features. You can cycle through previously used features by hitting the down arrow on the right side of the entry field and showing a drop-down menu.
How to Color-Code in Wireshark
On top of filtering, you can also use different colors to identify different packet types. For example, TCP RST is dark red and ICMP is light pink. Packets with errors are automatically coded black for ease of use.
Wireshark’s default settings have about 20 colors for you to choose from, and you can color-code your system however you like. You can edit, delete, and disable these at your leisure. If you want to turn off color-coding altogether, click on the VIEW menu and then COLORIZE PACKET LIST. If you want to learn more about color-coding in Wireshark in general, select VIEW>COLORING RULES.
How to Use Wireshark to View Network Statistics
The statistics function at the top of your screen is great for getting more information about your network. Wireshark gives you tons of metrics to break down packet information. Here are some of the main options from the menu:
- Protocol hierarchy: opens a window with a table of all of the captured packets
- Conversations: shows the network conversation between two endpoints, like one IP address to another
- Endpoints: shows a list of endpoints
- TcpPduTime: shows a record of how much time it took to retrieve data from a Data Protocol Unit
- VoIP calls: lists VoIP calls from live packet captures
- Multicast stream: sniffs out multicast streams and measures the speed of a bunch of other components
- IO graphs: shows all the graphs you make in Wireshark
- RTP statistics: saves content from an RPT audio stream straight into a separate file
- Service response time: shows how long it takes the network to respond to a request
Advanced Wireshark Features
If you’ve already mastered Wireshark and want to take your network performance monitoring to the next level, a collection of advanced features is hidden away in the software for you to play with. Among other things, you can use decryption software to work through encrypted packets and come up with your own protocol dissectors in Lua. Fun, right?
Getting the Most out of Wireshark
Since you know the basics of how to use Wireshark, it’s time to step it up. It’s great, but supplementary software makes it even better. There are also network monitoring tools compatible with Wireshark, and I’ve looked through them to bring you my top picks.
SolarWinds Network Performance Monitor
SolarWinds® Network Performance Monitor (NPM) is one of the best and most comprehensive networking monitoring tools on the market, and it offers networking monitoring above and beyond Wireshark capabilities alone. After all, you can never have too much analysis.
Network Performance Monitor is a multi-vendor network monitoring system specially designed for scalability and keeping your network safe. When it comes to network security, you can’t protect what you can’t see, and NPM lets you see everything. The LUCID interface (logical, useable, customizable, interactive, drill-down) gives you a complete summary of all network operations, so you can see your whole system without having to toggle back and forth between different views and screens. A live performance analysis dashboard shows your infrastructure in real-time.
Network Performance Monitor features a wide range of tools for monitoring and analyzing network performance, including a range of functions for packet analysis, advanced alerting, reporting, and problem diagnosis. It’s fully customizable, so you can switch around web resources, maps, and views based on what works best for your system.
Using Wi-Fi heat maps to identify network dead zones and areas with weak signals on the network is probably my favorite feature. It takes the guesswork out of finding out what parts of your network are experiencing the most lag. Is it an app? Is it my whole network? No more wondering. The NetPath™, PerfStack™, and intelligent map features in NPM are huge helpers when it comes to troubleshooting.
I use Network Performance Monitor to run continuous monitoring and analysis on my entire network. If you want to use Wireshark alongside this analysis, you can—but I’m not sure you’ll need it! Network Performance Monitor is a better enterprise-level solution, especially for those who don’t want to deal with the hassle of open source software. Just make sure you’re running NPM on Windows Server 2016 or later.
Free Response Time Viewer for Wireshark
Not sure if you’re ready to commit all the way? The free Response Time Viewer for Wireshark tool from SolarWinds is like a trial run of Network Performance Monitor. I’d recommend this one if you’re not ready to invest in a larger system.
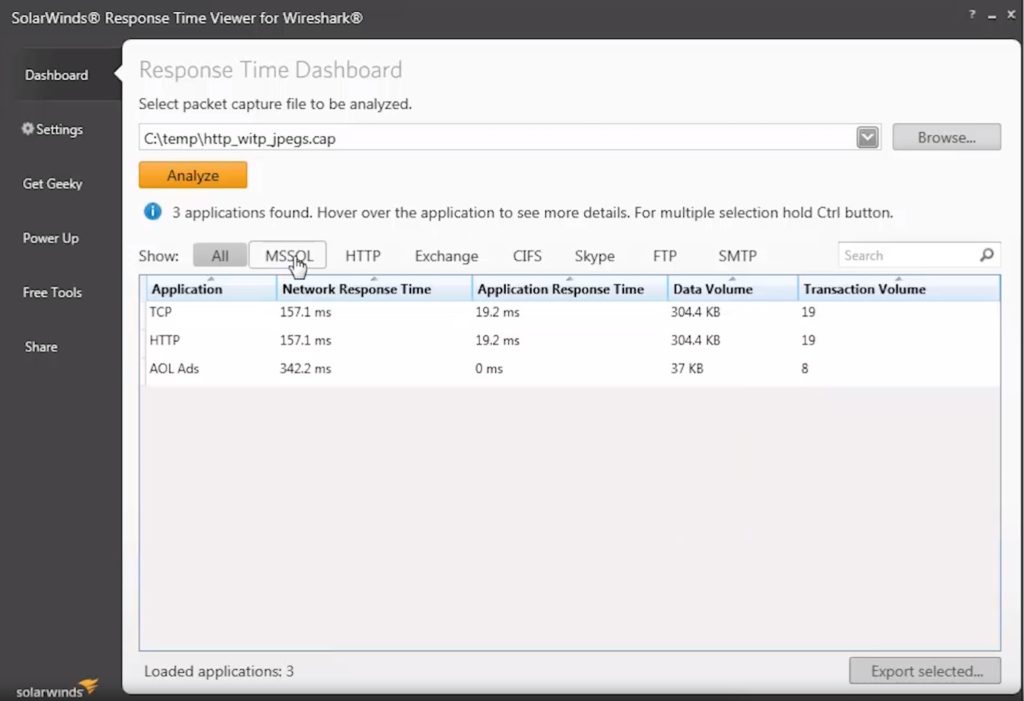
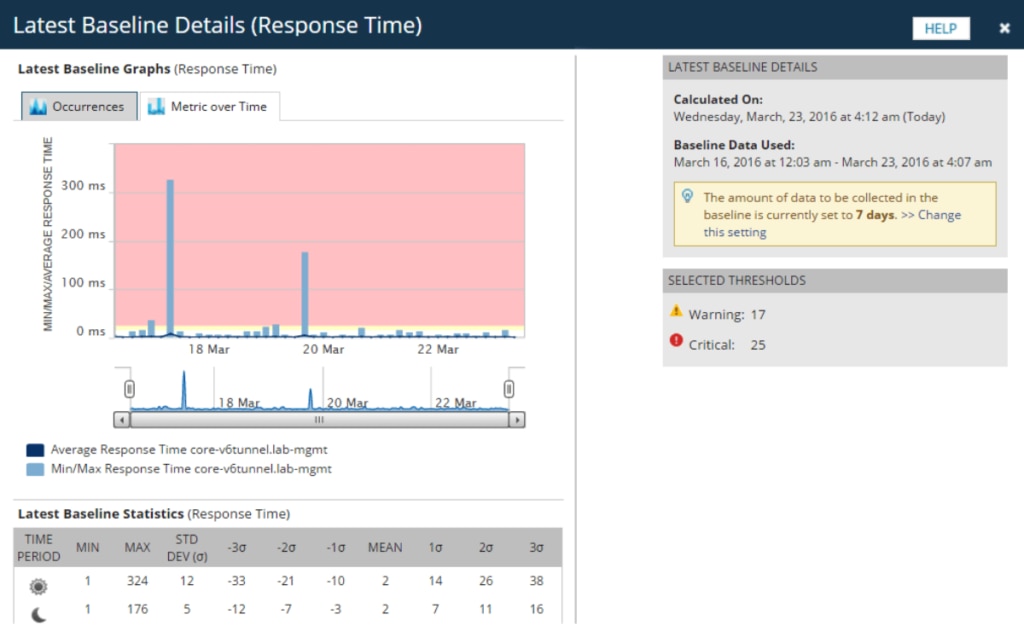
Response Time Viewer allows you to quickly run through Wireshark packet capture files, analyze them, and troubleshoot network performance issues based on what you find. It can calculate network response time in over 1,200 applications and show data/transaction volume in fine detail. All this makes it easier for you to see where your network might be a little slow and plan improvement accordingly. It shows you how it’s possible to build on what Wireshark can offer, and what new tools and features could help boost your network monitoring process.
Final Thoughts on Wireshark
This brings us to the end of our Wireshark how-to tutorial. I think you’ll find Wireshark a versatile tool, easy to use, and a welcomed addition to your software repertoire. If you decide to take the plunge and use Wireshark with your system, I highly recommend downloading a free trial of SolarWinds Network Performance Monitor for additional insights.