
So, you have a Kubernetes cluster. Let’s make sure you know how to see what’s going on inside. In this blog post, you’ll learn how to review logs from Kubernetes and what you may want to be running in it.
Start by Looking at the System
The first thing you may want to look at is how the Kubernetes master and nodes are behaving. The Kubernetes master controls the entire cluster—what’s running where and what needs to be provisioned—in coordination with the worker nodes.
There are three log files you can look at in the master node:
- /var/log/kube-apiserver.log– API Server, responsible for serving the API
- /var/log/kube-scheduler.log– Scheduler, responsible for making scheduling decisions
- /var/log/kube-controller-manager.log – Controller that manages replication controllers
These are the two log files you can look at on worker nodes:
- /var/log/kubelet.log– Kubelet, responsible for running containers on the node
- /var/log/kube-proxy.log– Kube Proxy, responsible for service load balancing
These logs tell you what’s going on and what can be helpful in troubleshooting problems with the master node. These logs sadly can’t be looked at through the kubectl command but instead need to be looked at directly from the machine. Depending on where you’re hosting the machine, you may have to SSH into the node directly. You can also use one of the many different logging consoles or aggregation services out there.
Since a lot of Kubernetes clusters are now being hosted in your cloud provider of choice, those master logs are a little bit trickier to get to. Most cloud providers will provide the logs through their logging interface. This means you don’t need to worry about the raw logs themselves and can just concentrate on the workers and what’s being deployed.
How to Look at a Running Pod
The most common things you’ll want to look at are logs from a running pod. The kubectl command has a log operation to give insight into your running pods with wonderful options to get you what you need quickly.
In the examples below, I’ll use a simple container printing out a timestamp every second. The pod descriptor looks something like this:
apiVersion: v1

kind: Pod

metadata:

  name: example

spec:

  containers:

    - name: example

      image: busybox

      args: [/bin/sh, -c, 'while true; do echo $(date); sleep 1; done']
After deploying this pod, let’s look at what the logs look like. We can do this by running kubectl log example, which should give us this kind of output:
➜ kubectl logs example

Mon Aug 31 11:45:28 UTC 2020

Mon Aug 31 11:45:29 UTC 2020

Mon Aug 31 11:45:30 UTC 2020

Mon Aug 31 11:45:31 UTC 2020

Mon Aug 31 11:45:32 UTC 2020

Mon Aug 31 11:45:33 UTC 2020

Mon Aug 31 11:45:34 UTC 2020

Mon Aug 31 11:45:35 UTC 2020
The first thing you can do is give it the name of the pod and get the logs straight out of the pod. This will probably be one of the most common tasks you can do with the kubectl command. If you don’t know the name of your pod, you can find it by running kubectl get pods.
Looking at Deployments
Now that we can see individual logs, what happens when you want to look at the group of pods? This is usually in the form of deployments. Thankfully, the kubectl command lets you look at deployments as well.
For this example, we’ll add a few more things to our pod. This time we want a timestamp along with a pod name, so we know which one we are looking at. The deployment descriptor is the following:
apiVersion: apps/v1

kind: Deployment

metadata:

  name: example

  labels:

    app: example

spec:

  replicas: 3

  selector:

    matchLabels:

      app: example

  template:

    metadata:

      labels:

        app: example

    spec:

      containers:

        - name: example

          image: busybox

          command: ["sh", "-c"]

          args:

            - while true; do

              echo ${MY_POD_NAME} $(date);

              sleep 1;

              done;

          env:

            - name: MY_POD_NAME

              valueFrom:

                fieldRef:

                  fieldPath: metadata.name
Now each pod will print out its name along with the timestamp. If we want to watch all those different pods and the logs they’re producing, first use the kubectl log deployment/example. Sadly, this will only pick one of the pods. However, there’s a way to look at all of them. See the following:
> kubectl logs -f -l app=example

example-5bc8d9cddc-bzpjj Tue Sep 1 11:47:03 UTC 2020

example-5bc8d9cddc-qppfk Tue Sep 1 11:47:04 UTC 2020

example-5bc8d9cddc-lnmw4 Tue Sep 1 11:47:04 UTC 2020

example-5bc8d9cddc-bzpjj Tue Sep 1 11:47:04 UTC 2020

example-5bc8d9cddc-qppfk Tue Sep 1 11:47:05 UTC 2020

example-5bc8d9cddc-lnmw4 Tue Sep 1 11:47:05 UTC 2020

example-5bc8d9cddc-bzpjj Tue Sep 1 11:47:05 UTC 2020

example-5bc8d9cddc-qppfk Tue Sep 1 11:47:06 UTC 2020
The command takes a flag (-l / –selector) that lets you filter by label. Since we tag our deployment pods with the example label, we can see all of them. The -f / –follow flag then continuously prints out the message from those pods.
Limiting the Number of Logs
Now that we’re getting the logs, we need to try to limit the number coming out (or maybe even get more). By default, if you select one pod, it will output everything. If you select multiple pods with a selector, it will only output ten lines per pod.
To limit the number of logs when selecting one, you would do something like this:
> kubectl logs my-pod --tail=10
The –tail flag takes in the number of lines you want and gives you the last N number of lines of logs from the pod.
If you’re using a selector and want to see more than the last ten per pod, you would just increase that –tail number to the desired number of logs. If you just output, it groups the pod’s logs together. It doesn’t coalesce the results together.
Selecting Different Containers in Pods
What happens when your pods have multiple containers? For example, what if you have an init container or a side car? How do you get those logs? By default, the log command will only output the first container’s logs. To get a specific container, use the following command:
> kubectl logs my-pod -c my-container
The -c / –container flag selects which container you want to get the logs from. The selector, tail, and follow flags work here as well. If you want to see all the init containers in a deployment, you can do so by adding the respective flags together, and the logs will output. If you want to see all the containers in one go, the –all-containers flag works here as well.
Outputting Timestamps
With our above examples, we’ve been echoing the timestamp in the logs. But what if your service isn’t logging any time data? What if it’s just messages? The kubectl command has a –timestamp flag that will prefix each log with a timestamp. It looks something like this:
> kubectl logs --timestamps my-pod

2020-09-02T11:31:41.601241133Z log

2020-09-02T11:31:42.60224873Z log

2020-09-02T11:31:43.602792923Z log

2020-09-02T11:31:44.603229439Z log

2020-09-02T11:31:45.603645177Z log
As you can see from the above, you can see the log messages at the end and the timestamp at the beginning. This can help you figure out where the log message is coming from, so you can track down when things happen, especially if the log message doesn’t have an embedded timestamp in it.
Putting the Pod Name in the Output
In our example above, we put the pod name inside the log message ourselves. But what if you don’t have the luxury? What if you have multiple pods you want to watch, but you also need to know where a message is coming from without outputting the individual pod’s logs and tying them together? Well, kubectl can prefix the pod name together to give you an idea. It looks something like this:
> kubectl logs --prefix --selector app=example --follow

[pod/example-86d59945c4-m6q8x/example] log

[pod/example-86d59945c4-j7bmh/example] log

[pod/example-86d59945c4-mb586/example] log

[pod/example-86d59945c4-m6q8x/example] log

[pod/example-86d59945c4-j7bmh/example] log

[pod/example-86d59945c4-mb586/example] log

[pod/example-86d59945c4-j7bmh/example] log

[pod/example-86d59945c4-m6q8x/example] log

[pod/example-86d59945c4-mb586/example] log
Each individual log message is now prefixed with the pod name and container name. This way you can track down where messages came from without having to do some complicated multistep process to get each log source.
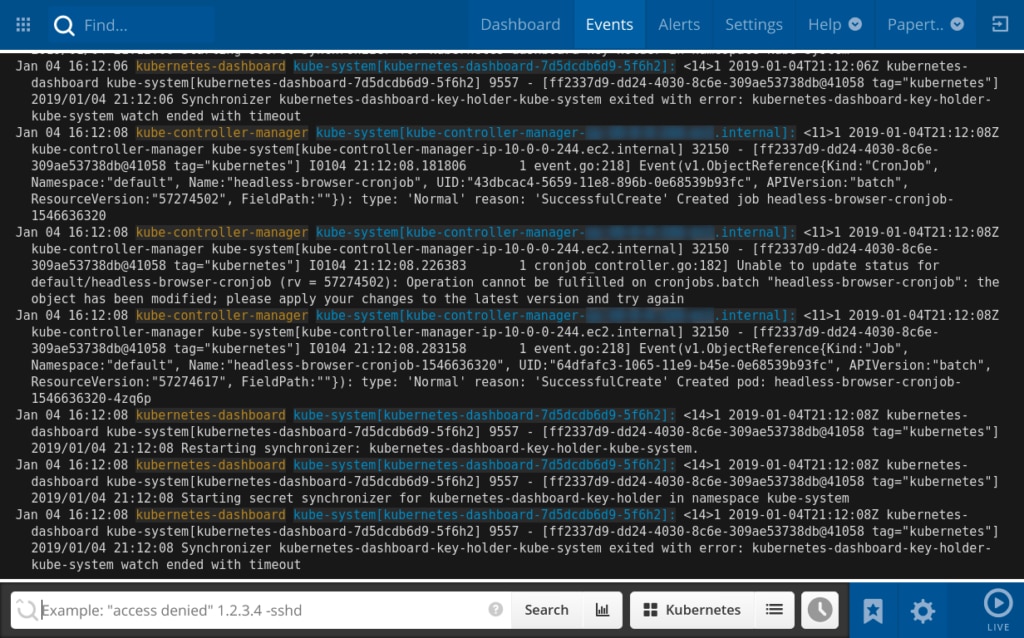
Log Aggregation Service
Even with all of the above commands, you still might not have an idea of what’s going on, or it may just be too complicated to get the data you’re looking for. This is where log aggregation services come in. They can help you by aggregating your logs into one source and give you a one-stop shop for all your logging information. A good product to look at is SolarWinds® Papertrail™. With Papertrail, you can consolidate all your logs in one location with a log management service in the cloud designed to be set up in minutes.
Conclusion
Hopefully this blog post has helped you familiarize yourself with the kubectl logs command and will help you look through the logs inside your Kubernetes cluster. There are so many ways to slice and dice and tailor the logs with this one command, but if you still need help, a logging aggregation service like Papertrail can help.
This post was written by Erik Lindblom. Erik has been a full stack developer for the last 13 years. During that time, he’s tried to understand everything that’s required to deliver high-quality, valuable software. Today, that means using cloud services, microservices techniques, container technologies. Tomorrow? Well, he’s ready to find out.