
Datadog is a well-known and popular tool, and the company that produces it is growing rapidly. At the same time, the application performance management market is also growing rapidly, and although Datadog is performing well, competition is increasing in the market. Many enterprises are finding competitors and similar tools are also useful, and in many cases better priced or easier to use.
There are several Datadog competitors, and it’s best to scout around and try out some free trials before you decide. However, some Datadog alternatives stand out more than others from the outset. My top choice is SolarWinds® Network Performance Monitor because it includes cloud network and application monitoring tools and more general performance management features. This comprehensive solution allows you to keep track of everything in one dashboard and can integrate with other SolarWinds tools to expand the number and types of features available to you.
What Is Datadog?
Why Use a Tool Like Datadog?
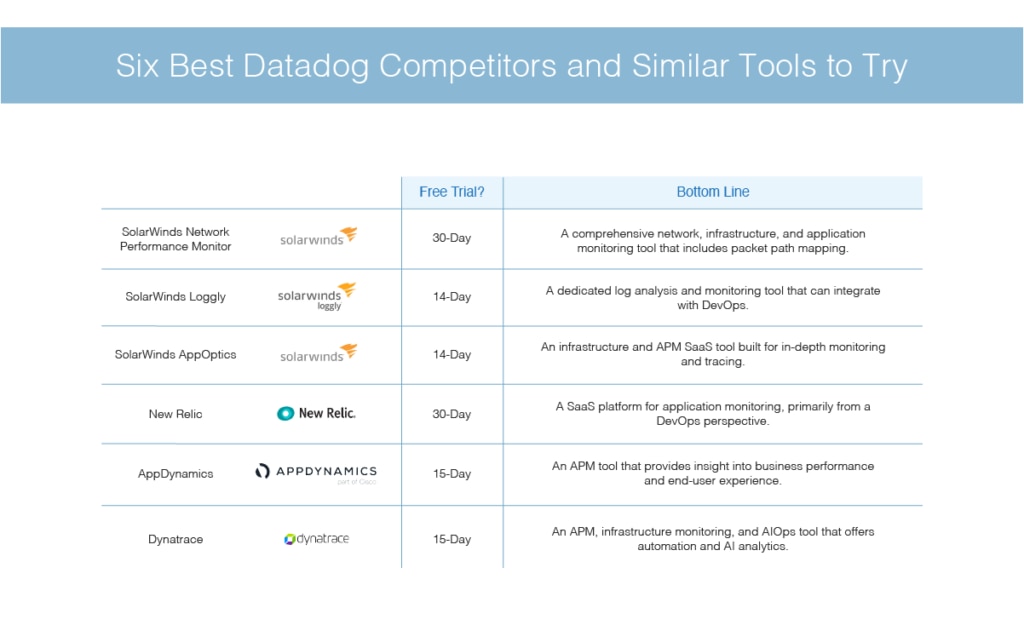
6 Best Datadog Alternatives
Choosing a Tool Similar to Datadog
What Is Datadog?
Datadog is an analytics tool used for monitoring and assessment of applications based in the cloud. It monitors your systems, databases, applications, and services from an interface structured as a SaaS offering. It integrates with various tools and services through agent-based integrations for monitoring most commonly used application frameworks. In addition, once you’ve gathered all the metrics from your monitoring processes, you can create aggregated reports and visualizations.
Why Use a Tool Like Datadog?
Datadog helps integrate metrics and events across the full stack and can monitor and troubleshoot application performance. This allows you to keep track of your overall network health and see how your infrastructure is performing and functioning. Datadog can monitor distributed architectures, hybrid environments, and microservices.
You can also use it to optimize performance and enhance communication between applications or different parts of your infrastructure. Datadog includes log analysis tools designed to automatically generate logs and analytics, so you don’t have to spend time sifting through information. It sends you alerts when critical issues arise, which means your troubleshooting can get underway shortly after a problem has occurred.
Although Datadog is a comprehensive and high-quality tool, it does involve a steep learning curve. Depending on the size of your enterprise, I think Datadog can also be expensive as the per server and per month pricing model can easily add up when operating at scale.
6 Best Datadog Alternatives
There are many similar tools to Datadog, and certain circumstances might lead you to seek a Datadog replacement—for example, if you need something more user-friendly, or something that integrates with a wider range of tools.
As you sort through the various Datadog competitors, look for a solution that suits your needs and can be used in your organization over the long term, particularly if you’re in a large enterprise environment. The following Datadog alternatives were selected specifically with enterprises in mind.
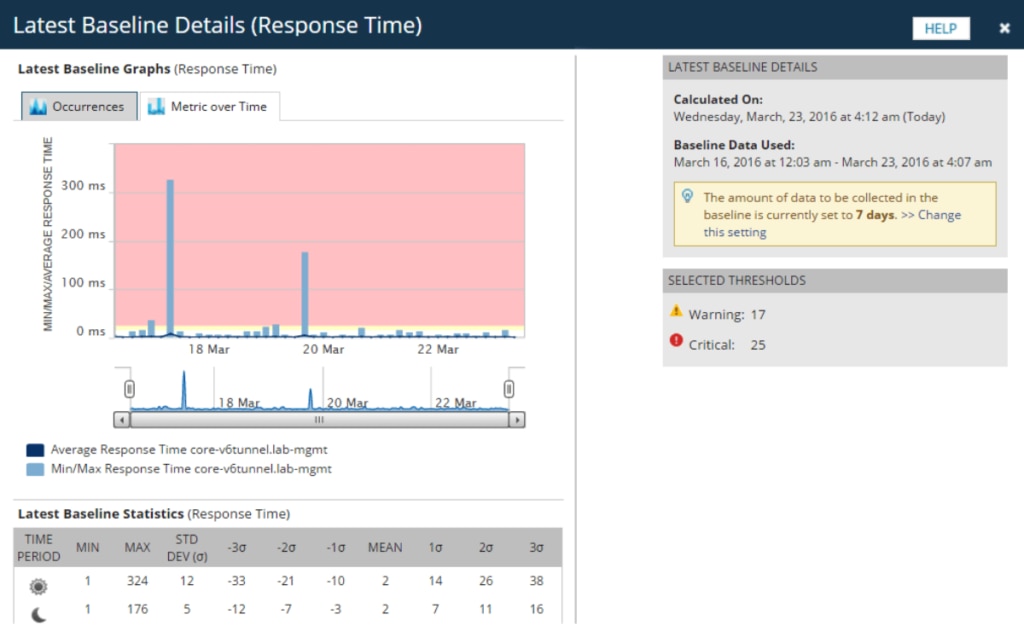
My first choice among available Datadog alternatives is SolarWinds Network Performance Monitor (NPM). NPM offers network and application monitoring tools, including the ability to track packet response times for your applications and networks. This means you can pinpoint whether a problem concerns the network or a specific application. You can also isolate metrics for your networks and applications by type, time, or other factors, and then examine these factors in more detail if you need to, similar to Datadog.
NPM includes network sniffer software, like the Datadog packet flow feature, is designed to help ensure visibility without impacting performance. However, NPM also includes a dedicated Quality of Experience module to track and analyze traffic for specific applications; you can also set response times in your network, including the TCP handshake, time to first byte for applications, and traffic types.
Like Datadog, this tool is designed to work with cloud-based servers and applications. The NetPath™ feature displays metrics for each network node and provides a visual map of the pathways between them, which isn’t the same as the service map in Datadog. When a new service is created, NPM will automatically look for network paths, including over the internet. NPM can then examine those pathways for performance issues and slowdowns.
In addition to these features, NPM includes network alerting tools similar to Datadog alerts, so issues can be spotted quickly and discovered before they impact your end users. Default alerts are included; you can choose to customize them and set up thresholds or timing to avoid getting overloaded by alerts. As in Datadog, alerts can also be configured to be more detailed or less detailed, or to provide specific information, so you can focus on the details most important to you.
You can access a free trial of NPM for up to 30 days.
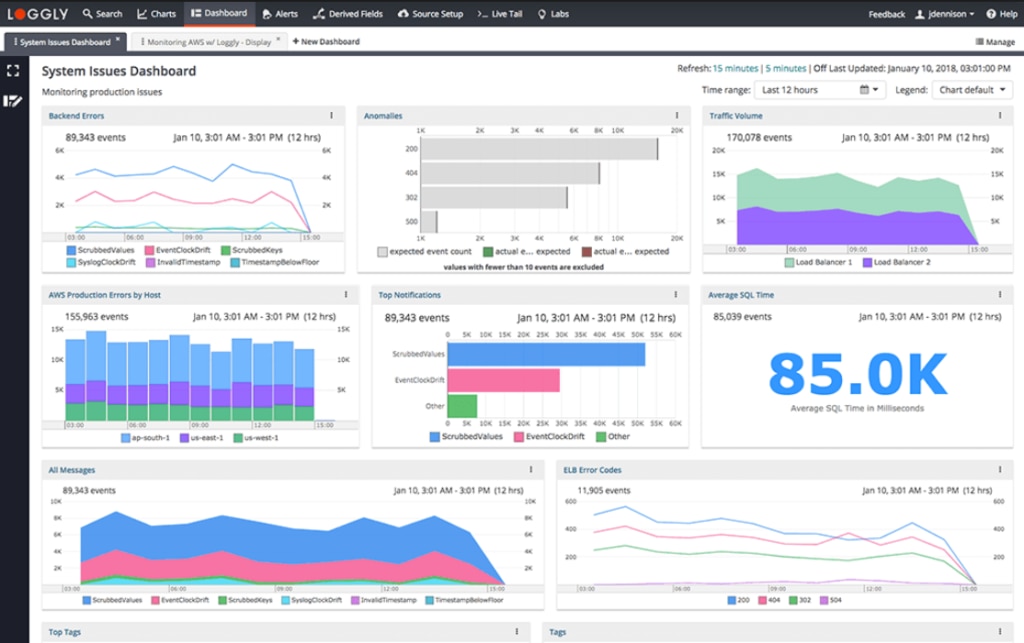
Loggly® is another good option if you’re looking for a tool similar to Datadog. This one is focused much more specifically on logs and log management. It’s a high-quality but easy-to-use tool. It’s similar to the Datadog Logging without Limits feature that also allows for log collection, processing, live tail, metrics, and other critical logging features.
Loggly is primarily designed for monitoring application health, trends, and overall behavior. In addition, it includes prebuilt dashboards with monitoring KPIs and statistics already set up, making it easy to get going. You can view data over time using different chart types, so you can see an issue from many different perspectives and combine different data types or processes to pinpoint issues. Datadog also offers some customizable visualization features for logging.
Loggly works with typical alerts and issue detection, but it also learns the typical patterns in your log data, so anomalies can be spotted quickly. This is the case even if the anomaly hasn’t triggered any alerts or might not show up easily in search results. (With some configuration, Datadog connects to log-based metrics, so you can alert on anomalies.)
Finally, Loggly integrates well with common DevOps tools, so you can share information across your team and analyze the performance of your network and applications together. Like Datadog, its monitoring and analysis tools extend to cloud environments and cloud-based applications.
Loggly is a relatively narrow tool in terms of functionality—it’s designed for excellent monitoring through log and behavior analysis and doesn’t go far beyond that in terms of features. However, this good-quality tool comes recommended. A 14-day free trial is available.
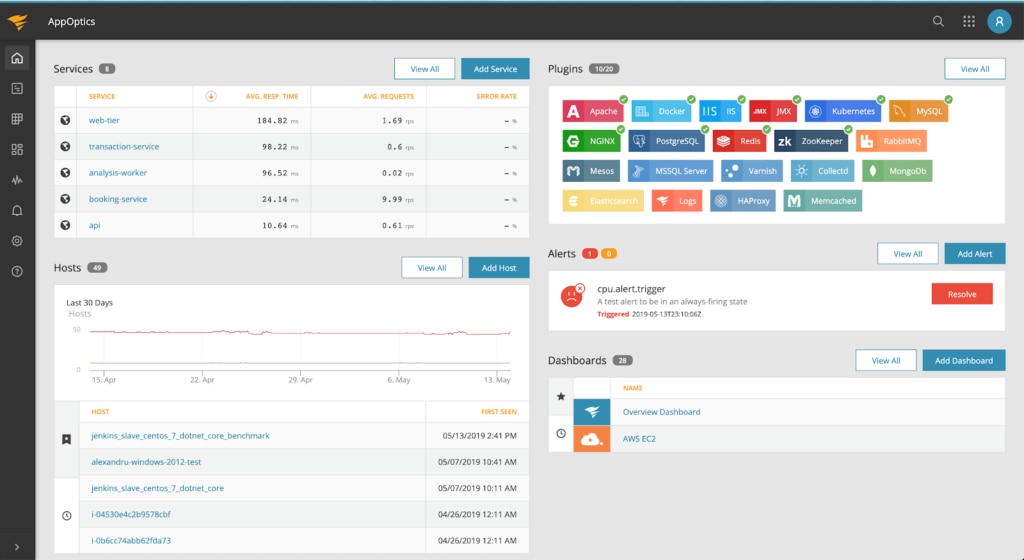
SolarWinds AppOptics™, a SaaS-based tool, is specifically designed for infrastructure and application performance monitoring, including AWS, Azure, and hybrid environments. Like Datadog, AppOptics provides application performance monitoring with distributed transaction tracing, which means it looks at the entire request. If you add extra services or APIs, you can still see the links between bottlenecks in the environment and the end-user impact. With live code profiling, you better see why slowdowns are occurring. As with Datadog, you can look at code and applications in staging and find issues before you put the application into production, stopping issues from affecting your users in the first place.
Another great feature is the exception tracking tool, which shows you what exceptions exist, when they started, and which ones occur most frequently. (Datadog makes it possible to catch errors as well.) You can look at each one for more details and figure out where they’re coming from within the application. This allows you to have a more complete picture of your applications and how they work within your environment and with your users and their experience.
The AppOptics tool is presented as part of one unified dashboard and displays both infrastructure and APM metrics in one centralized location. As with Datadog, performance alerting is all displayed in one place, and you can combine logs, metrics, or traces for reporting and analytics purposes. These dashboards and reports can also be customized to show only what’s important to you. AppOptics is designed for both custom on-premises and distributed cloud applications. Click here to try it free for 14 days.

New Relic provides several products, some of which are for management purposes, some for improving user experience, and some for DevOps in particular. These different products can be used separately or combined with each other to create a full product suite that monitors and manages your entire system on-premises, in the cloud, or in a hybrid environment.
Like Datadog, New Relic offers a multi-tenant SaaS platform designed to help with easy and fast setup. With auto-instrumentation and out-of-the-box views, you don’t need to set up a lot of tools or configure servers to get started understanding your application environment.
Like Datadog, New Relic includes in-depth transaction details to show information on the exact method calls, including line numbers. It also displays which external dependencies are present for your apps, no matter how complex the dependency tree is (similar to Datadog dependency visualizations). You can combine information from your applications with data on your services, datastores, and hosts, so you can create a holistic overview of your entire IT environment.
This holistic monitoring approach allows you to keep your applications and services running in a transparent and synchronized manner, as well as being able to see the impact of code and configuration changes on application performance. (For Datadog, seeing this information in real time requires a Bitbucket integration.)
New Relic, like Datadog, also includes tools for intelligent analysis, including unified pattern recognition and machine learning capabilities. This can help reduce the amount of time it takes to spot or fix a bug and can also give you intelligent guidance as to how best to focus your time. It provides end-to-end visibility into your application stack and helps you monitor performance, troubleshoot quickly, and keep your IT environment protected from errors. A free trial is available.
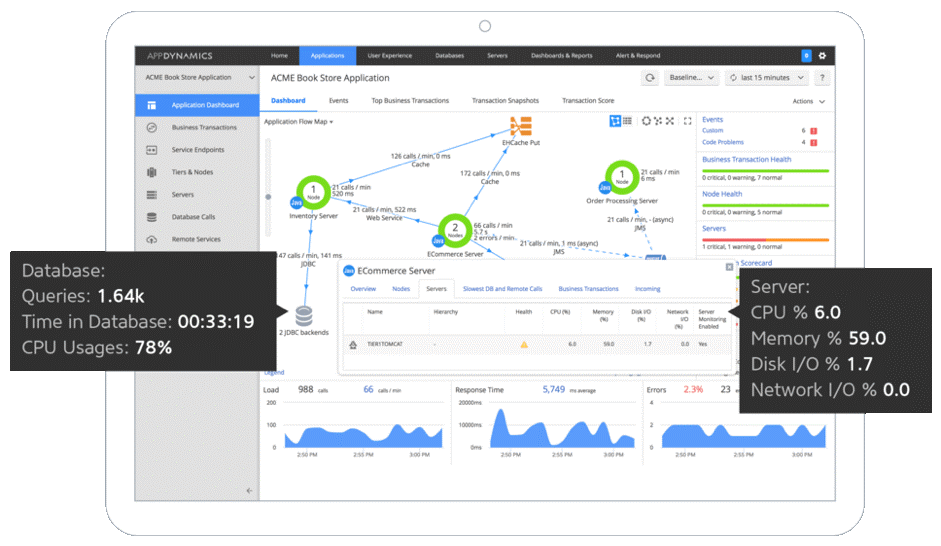
Another good option to look into is AppDynamics. Like Datadog, AppDynamics offers a cloud monitoring solution for cloud-based applications, with end-to-end monitoring of application components, code, and infrastructure resources. It can work with public and private clouds, or hybrid cloud setups. It works well with Docker containers, Kubernetes, Amazon AWS, Microsoft Azure, and others.
Like Datadog, AppDynamics includes tools to monitor application transactions, service levels, and throughput for your applications. You can keep track of user journeys and see how errors or slowdowns are affecting them and use root cause analysis powered by AI to quickly resolve problems. This capability is offered through the Business iQ feature, which produces visualizations to show links between user experience, application performance, and business performance. (Datadog offers similar built-in machine learning to simplify troubleshooting, while Datadog Browser Tests provide user experience insights.)
This tool is specifically designed for application monitoring in the cloud, so it can be a good alternative to Datadog. However, I believe it can be difficult to get set up, and the learning curve is steep compared to some other Datadog alternatives on this list. But overall, this is a good product with useful features to help you keep track of your applications and their performance. A free trial is available.
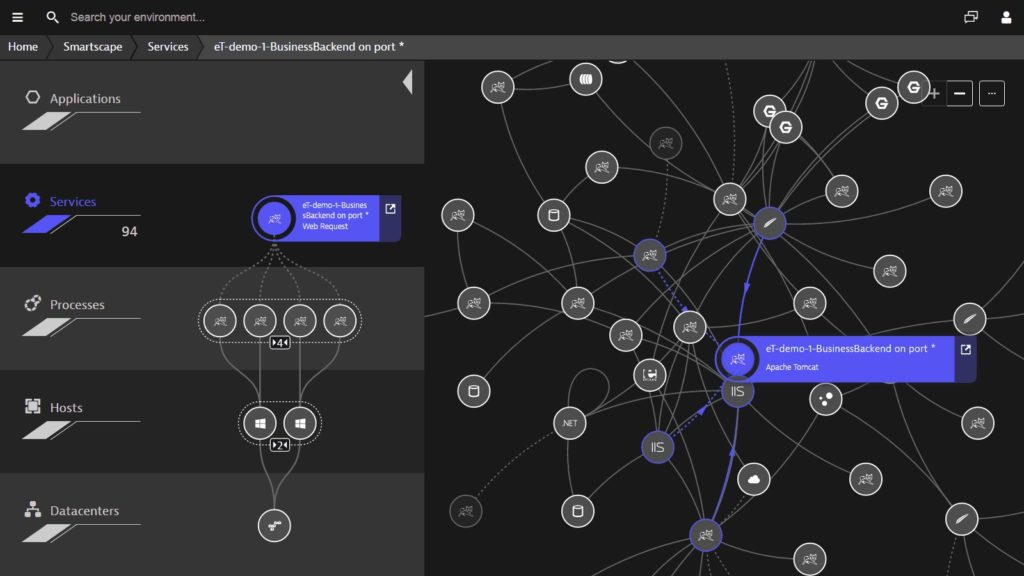
Dynatrace is another Datadog alternative offering APM, infrastructure monitoring, and AIOps in a single solution with one centralized dashboard for management. Like Datadog, this tool has a multi-side approach, using observation of metrics, logs, and traces, alongside user experience discovery and network topology information. All this together is displayed in one centralized dashboard, and then can be combined and analyzed through the Dynatrace artificial intelligence tools.
One of the useful features of Dynatrace is the real-time topology map of your network, cloud applications, metrics, logs, and other data. This is similar to the visualization features in Datadog. You can use the Dynatrace map to view the causal dependencies between each aspect and the data for each piece. This allows you to easily see how one part of your system affects another. In addition, this map is used by the Dynatrace AI engine, Davis. Davis uses the topology map and accompanying information to automate root cause analysis, and to help you troubleshoot any issues quickly and precisely. (Datadog provides machine learning features, though not tied directly to mapping.)
As in Datadog, the Dynatrace auto-discovery feature populates the topology map and detects your applications, containers, processes, and infrastructure as soon as you begin using it. This helps you get the process underway quickly. Using automatic baselining, Dynatrace can easily detect and define normal performance, and alert you if there are any unusual behaviors or issues coming from your IT environment. Datadog offers similar anomaly alerting.
Finally, you can link the infrastructure-based metrics from Dynatrace into customer experience and sales data, to look at conversions, orders, customer segments, release validation, and other important details. This can help you determine whether your application performance and digital experience are aligned with your overall strategy. Datadog offers a look into user experience, but not in the same detail.
I think the dashboards in Dynatrace are slightly limited, and it could provide more customization options. In addition, I believe it can be a bit hard to figure out how to get started for a new user, particularly those who are coming from the business side and are less technically oriented. A free trial is available.
Choosing a Tool Similar to Datadog
Datadog is an application and infrastructure monitoring tool offered through a SaaS model, and any alternative should match the end goals Datadog accomplishes. Datadog integrates an APM tool with infrastructure monitoring and finding this in a cost-effective alternative can be hard, especially when considering other factors such as usability and learning curve. However, there are options out there, and the selection of tools listed above should set you on the road to choosing among the Datadog alternatives.
There are many Datadog competitors and choosing the right one for you is important. Think carefully about how you plan to use the tool in your business, how easy it is to get started, and what kind of scalability or feature extension is available if you want to use the same tool or vendor for your entire IT infrastructure as time goes on.
When it comes to application and log monitoring, I recommend SolarWinds Network Performance Monitor as an alternative to Datadog, though SolarWinds Loggly and SolarWinds AppOptics are also high-quality tools. NPM offers a solid foundation in terms of features and is easy to set up and get started with. It works well as a cost-effective enterprise solution, is high-powered and rich in features, and doesn’t have a steep learning curve, making it easy for different team members or changing teams to use the software from the get-go. Take advantage of the free trial to see how it works within your organization.
*As of June 3, 2020