
In today’s highly distributed IT environment, monitoring a massive number of applications across diverse environments is a challenge. Moreover, application performance monitoring requires data for multiple dimensions, including user-experience information, application interactions data, usage and performance data of all application dependencies such as web servers and databases, and other application-related details such as application log data, errors, and real-time user monitoring. A comprehensive infrastructure and application performance monitoring solution provides clear visibility to track multiple components of applications and the back-end infrastructure via a wide range of visually represented metrics to troubleshoot application bottlenecks. Let’s take a look at how infrastructure and application performance monitoring solutions work and which tool is best between AppOptics vs. New Relic.
Key Aspects of Infrastructure and Application Performance Monitoring Solution
Infrastructure and application monitoring solutions automate the performance monitoring process and simplify the collaboration, management, and analysis of data from multiple business applications and the related servers, databases, and other systems. Actionable insights and real-time metrics concerning applications performance and resource usage help in adhering to SLAs, capacity planning, and pre-empting bottlenecks. Key aspects of a performance monitoring solution are listed below:
- Exception Tracking: When handling multiple requests, sometimes application errors occur. With exception tracking features and service instances, the APM tools help recognize these errors and throw an exception containing an error message and a stack trace.
- Transaction Tracing: Profiling an end-to-end behavior of a request during application runtime helps to analyze the transaction flow across each application architecture tier to pinpoint where the application is becoming sluggish.
- Code Diagnosis: If transaction tracing unveils performance issues at the application server, developers must drill down and verify if the problem is in the application code. This helps to determine the specific line of code, database query, or any API impacting the processing time.
- Infrastructure Visibility and Insights: Infrastructure impacts the application performance, and issues such as poor network connectivity, memory shortage, or storage limitations may cause a major impact. Thus, infrastructure monitoring must be integrated into an application performance monitoring solution.
Infrastructure and Application Performance Monitoring Tools
SolarWinds AppOptics
© 2020 SolarWinds Worldwide, LLC. All rights reserved.
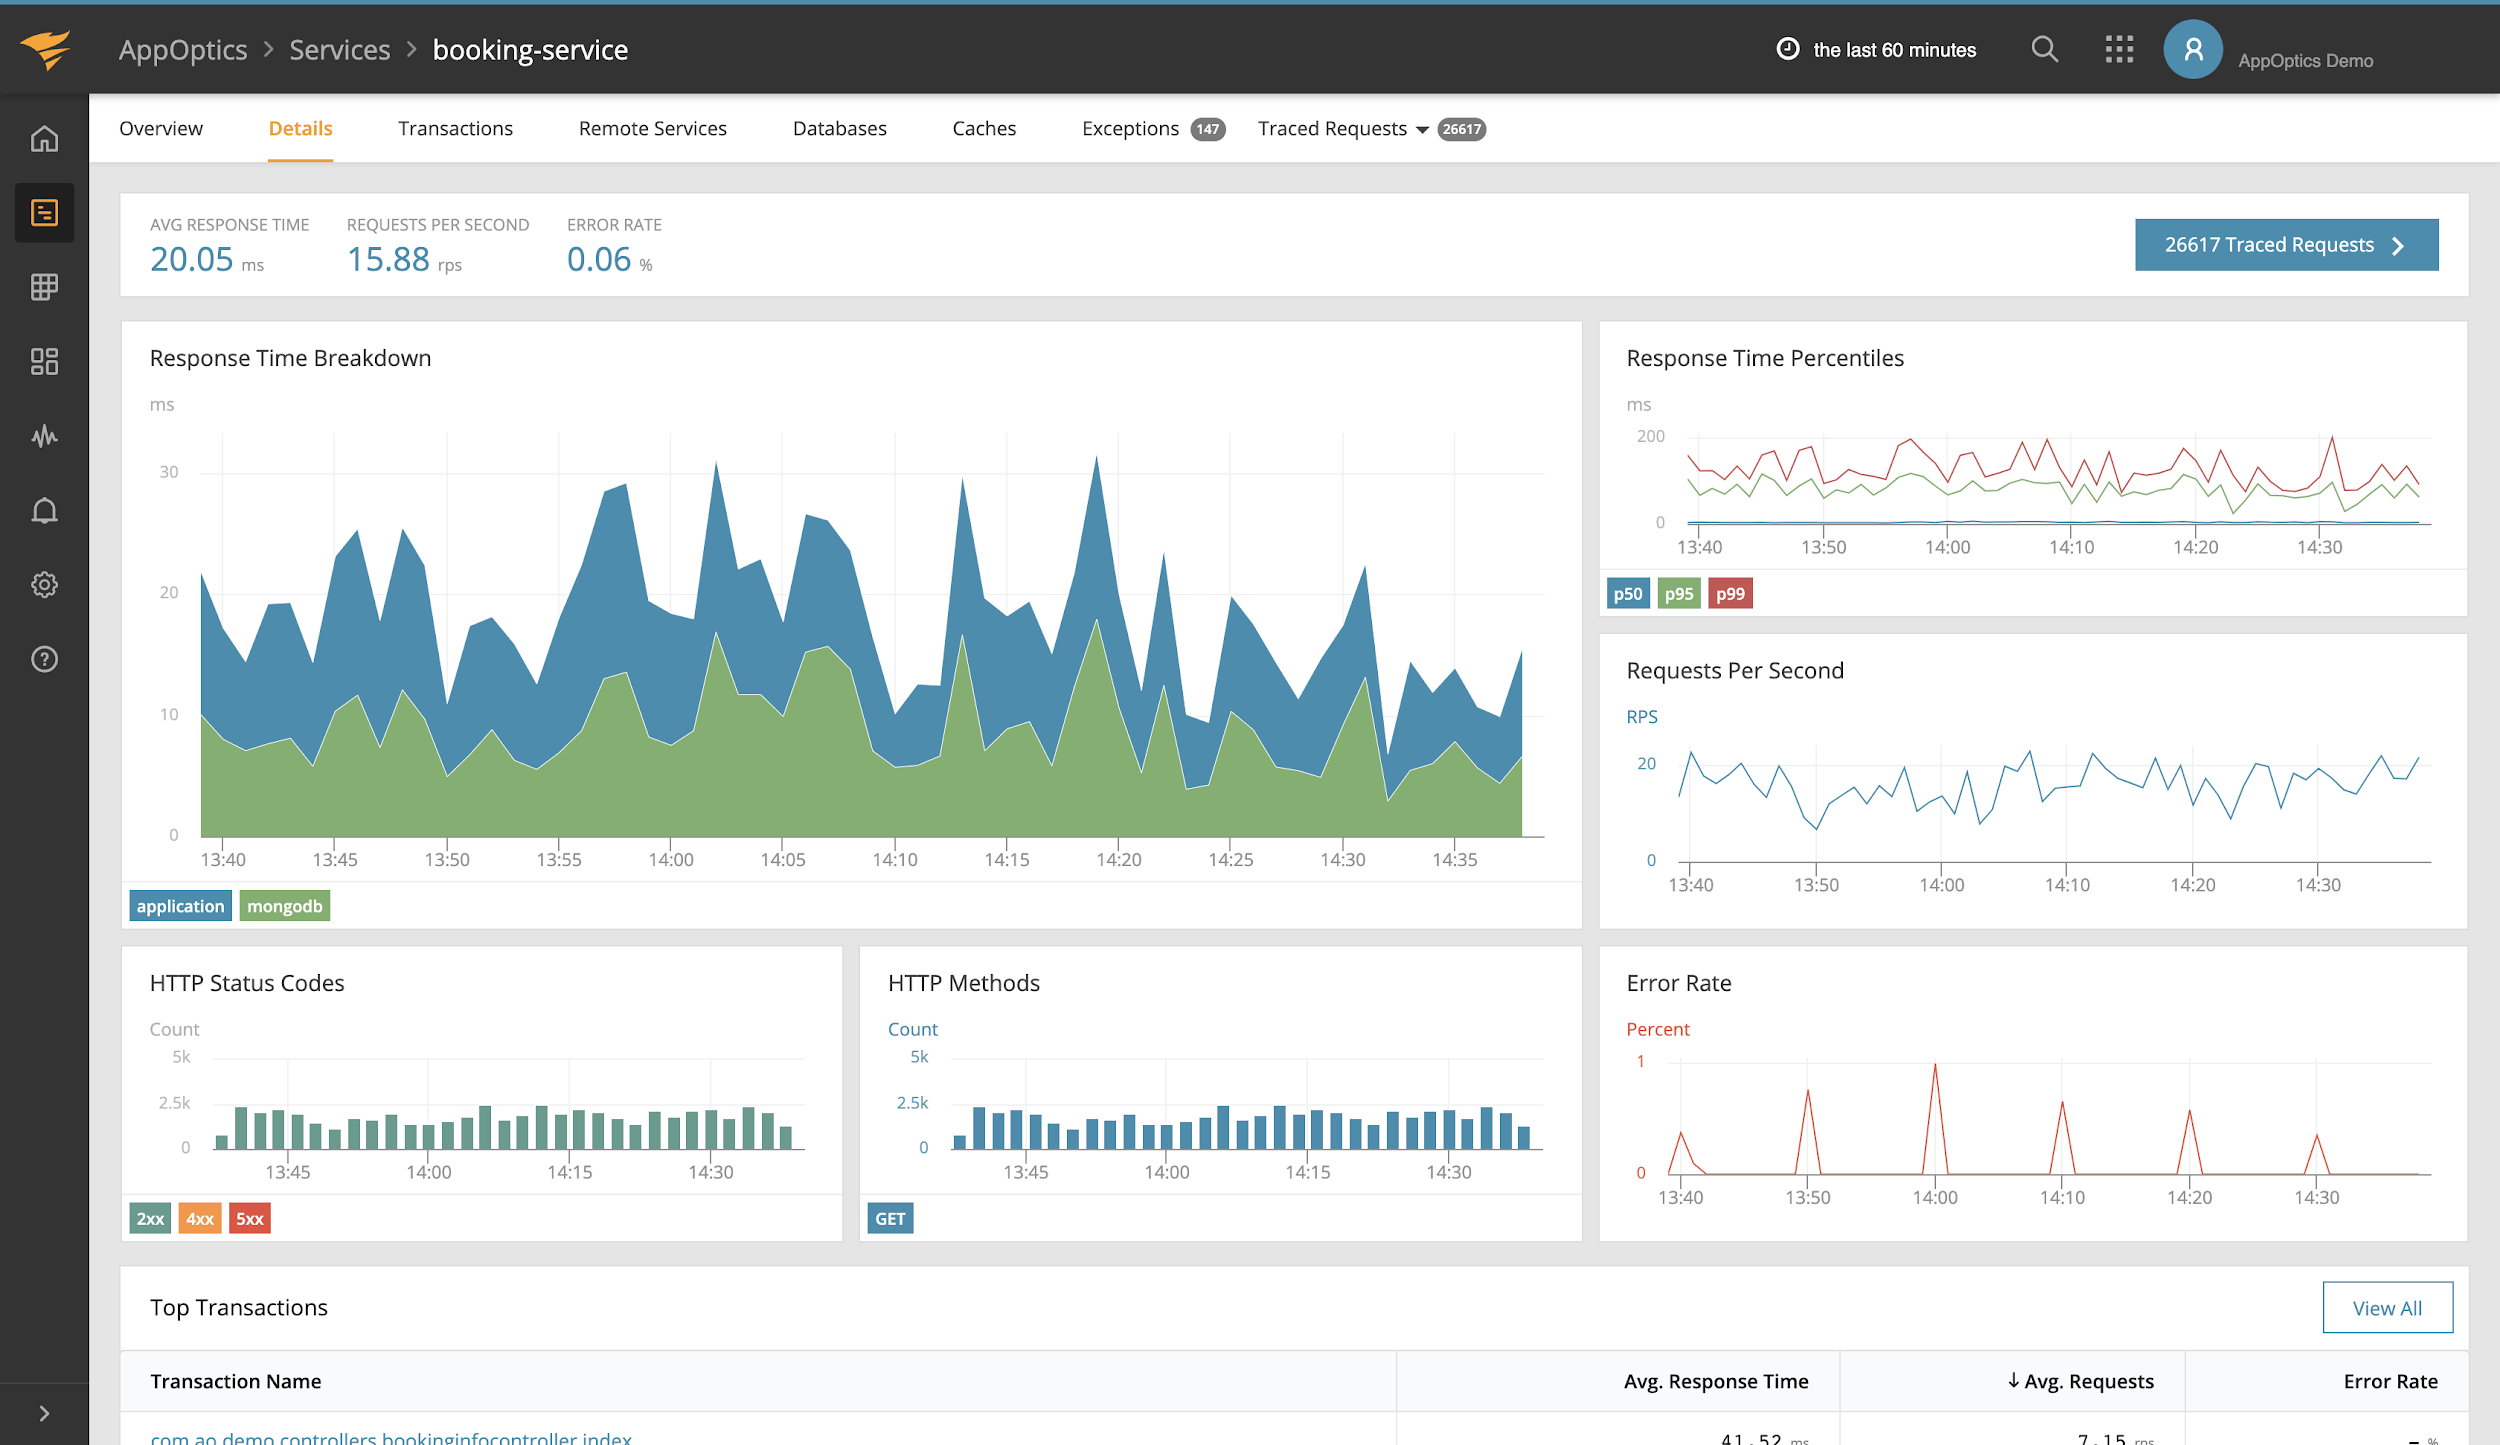
SolarWinds® AppOptics™ is a comprehensive infrastructure and application performance monitoring solution catering cloud-native, on-premises, and hybrid IT environments. AppOptics consolidates your infrastructure along with the applications and services running on those systems to provide a unified view of the complete stack and allow centralized tracking of the performance of every component in one place.
With AppOptics, you can focus on resolving performance issues with drill-down root cause analysis and not go beyond diagnosing problems. It offers features such as distributed tracing, exception tracking, and live code profiling to troubleshoot application performance issues seamlessly. The highlight of AppOptics is it brings together infrastructure, application, and business metrics under a single unified dashboard to effectively compare or cross-reference the application metrics and infrastructure metrics on a single screen, which significantly reduces mean time to resolution (MTTR). AppOptics allows you to leverage a set of turnkey infrastructure integrations, including an array of AWS and Azure services, network, web, database, and containers. It supports dozens of frameworks and libraries, including PHP, Python, Java, Node.js, Ruby, Scala, Go, and more. Also, with advanced alerting, AppOptics helps ensure you receive proactive notifications for every event when your applications and infrastructure fall short of defined performance thresholds.
New Relic
© 2008-20 New Relic, Inc. All rights reserved.
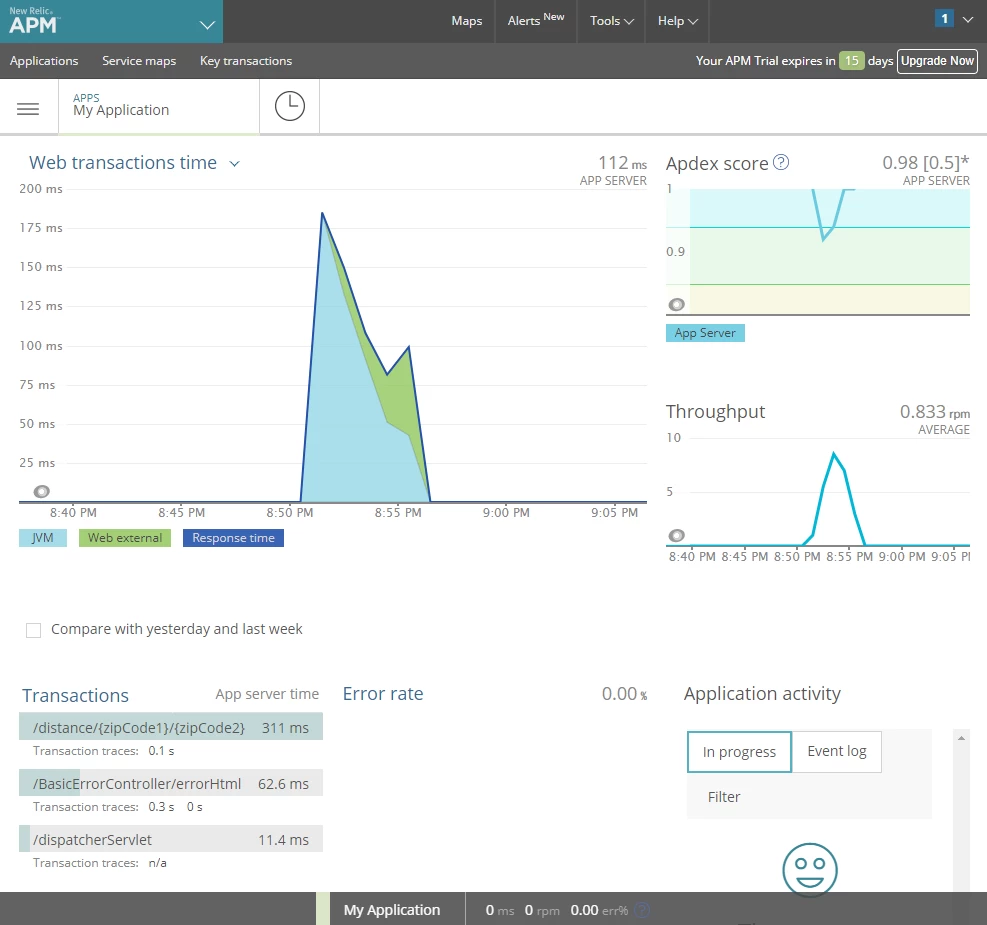
New Relic on the other hand is a SaaS-based application performance management solution providing a platform to streamline and compare key application metrics along with the usage and performance parameters of related servers, services, and databases. Like other modern application monitoring tools, New Relic also supports interaction tracing followed by code-level data tracing to discover the deeply rooted issues across applications and associated services or infrastructure. It helps to visually analyze how your applications use CPU, memory, database, and other resources. Furthermore, it offers alert functionality to proactively flag unusual events before they impact the application performance.
AppOptics vs. New Relic
Both SolarWinds AppOptics and New Relic are modern SaaS-based infrastructure and application monitoring solutions bringing data from across your technology stack in one place and automating root-cause analysis to troubleshoot performance issues. However, there are marginal differences between these tools in terms of features and functionality. AppOptics provides auto-instrumented application performance monitoring through distributed tracing, live code profiling, and exception tracking to identify the specific performance problem or issue. In contrast to New Relic, AppOptics tightly consolidates your infrastructure together with the applications and services running on those systems to give a unified view of performance across the stack.
- Auto-Instrumentation for Programming Languages
AppOptics allows you to automatically instrument your applications instantly in dozens of frameworks and libraries including Go, Java, .NET, PHP, Ruby, Python, Scala, and Node.js. It helps to monitor the performance of applications in real-time across many different programming languages. On the other hand, New Relic supports auto-instrumentation for the seven programming languages, including C, Go, Java, .NET, Node.js, PHP, Python, and Ruby.
- Unified Dashboards and Alerting for Application and Infrastructure Monitoring
AppOptics offers centralized dashboards and a unified alerting system designed to eliminate the wall between application performance management and infrastructure metrics. It facilitates cross-reference across application performance, servers, and infrastructure metrics simultaneously on the same dashboard. Unified dashboards streamline troubleshooting efforts and drastically reduce the resolution rate. On the other hand, New Relic requires you to combine New Relic APM with New Relic Infrastructure to overcome the complexity of modern scalable applications and get the operating environment information on a single screen.
- Exception Tracking
Unlike New Relic, exception tracking built on top of the AppOptics automatic tracing capability provides a summary of exceptions happening within a service context. With a single click, you can track the number of exceptions and trace the endpoints in the application which are driving the exceptions.
Conclusion
Businesses are increasingly turning to infrastructure and application performance monitoring tools to ensure seamless user experience, smooth IT operations management, and faster overall digital transformation. Every modern infrastructure and application monitoring tool is distinct and offers a host of functionalities. Therefore, it’s critical to carefully evaluate the capabilities and select the solution catering to your business needs. Check out the free trial versions of AppOptics and New Relic to explore their features, specifications, and get hands-on experience to understand how these tools work.
*As of June 23, 2020