
Aurora is a powerful relational database engine that, when used correctly, can deliver very high performance. This article provides a list of key Aurora performance tuning best practices to help you take full advantage of its potential.
The easiest and most effective way to manage Aurora is with an Aurora performance tuning tool like SolarWinds® Database Performance Monitor (DPM). DPM can help streamline your Aurora performance optimization activities, helping ensure performance is high, consistent, and reliable. A 14-day free trial of DPM is available.
- What Is Aurora?
- The Basics of Aurora
- Aurora Performance Best Practices
- Choosing the Right Aurora Performance Tuning Tool
What Is Aurora?
Amazon Aurora is a fully managed relational database engine compatible with both PostgreSQL and MySQL. PostgreSQL and MySQL combine the reliability and speed of enterprise-grade databases with the cost-efficiency and simplicity of open-source alternatives. If you have existing code, applications, and tools you use with your PostgreSQL and MySQL databases, these can also be used with Aurora.
According to Amazon, Aurora is able to deliver up to five times the throughput of MySQL and up to three times the throughput of PostgreSQL, without requiring alterations to most of your existing applications.
Aurora offers a high-performance storage subsystem, with its MySQL- and PostgreSQL-compatible database engines customized to leverage rapid distributed storage. To accommodate changing requirements, the underlying storage system scales up automatically when necessary, up to 64 TB. Aurora can automate and standardize database clustering and replication, which are among the most difficult aspects of database administration, configuration, and management.
Aurora is part of Amazon Relational Database Service (RDS), a managed database service. Since Amazon RDS is a web service, it’s easier to set up, operate, and scale a relational database in the cloud.
The Basics of Aurora
There are several operational basics every Aurora administrator should follow. The Amazon RDS Service Level Agreement requires you to follow these guidelines:
- Monitor CPU, memory, and storage usage. You can set up Amazon CloudWatch to alert you when usage patterns change or when you approach deployment capacity, enabling you to maintain system availability and performance.
- If your client application is caching the DNS data of your database instances, you should set a time-to-live value of less than 30 seconds. The underlying IP address of a database instance can vary after a failover—which is why caching DNS data for an extended time can result in connection failures when your application attempts to connect with an out-of-service IP address. Database clusters with numerous read replicas can also experience connection failures when connections use the reader endpoint and one of the read replica instances is deleted or under maintenance.
- To comply with Amazon RDS Service Level Agreements, you are also required to test failover for your database cluster. This will help you understand how long the process takes for your use case and ensures the application accessing your database cluster can automatically connect to the new cluster after failover.

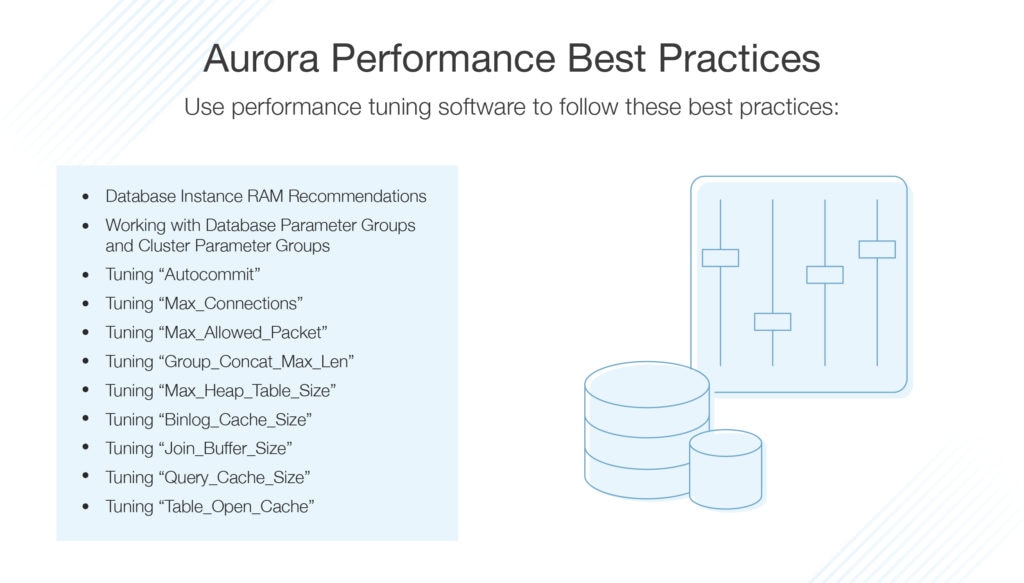
Aurora Performance Best Practices
The following best practices can assist with Aurora performance tuning and help you avoid common errors that could degrade system performance or result in instability.
-
Database Instance RAM Recommendations
A key part of successful Aurora performance tuning is ensuring you have allocated enough RAM, so your working set resides almost entirely in memory. To determine if your working set is almost all in memory, use Amazon CloudWatch to monitor and examine the following metrics:
- BufferCacheHitRatio: This metric measures the percentage of requests served by the buffer cache of a database instance in your database cluster. This gives you an insight into the amount of data being served from memory. If the hit ratio is low, this may indicate your queries on this particular database instance are going to disk more often than they should. If this is the case, you should examine your workload to determine which queries are responsible.
- VolumeReadIOPS: This metric measures the average number of read I/O operations from a cluster volume, reported in five-minute intervals. The value of VolumeReadIOPS should be stable but small. If your read I/O is higher than usual, you should examine the database instances in your database cluster to determine which are responsible for the spiking I/O.
If, after examining your workload, you determine more memory is required, you could benefit from scaling up the database instance class to a class with more RAM. Once you’ve done this, check the metrics listed above again and continue to scale up until you’re satisfied.
-
Working With Database Parameter Groups and Cluster Parameter Groups
Before applying parameter group changes to your production database cluster, try the alterations out on a test database cluster beforehand. If database engine parameters are improperly configured, this can have negative effects, sometimes resulting in system instability and degraded performance. When making changes to your database engine parameters, be sure to exercise caution and back up your database cluster before altering a database parameter group.
-
Tuning “Autocommit”
When enabled, autocommit automatically commits transactions to disk. If disabled, multi-statement transactions must be explicitly started and committed, or rolled back. If a transaction isn’t explicitly started, each successful statement will be automatically committed. We advise setting the autocommit value to 1 or ON, which should be the default. This ensures every SQL statement is automatically committed as you run it, unless it’s part of a transaction opened by the user.
Tuning autocommit correctly is important because a value of OFF could encourage incorrect usage patterns, such as transactions being held longer than required. This can impact the stability and performance of your database.
-
Tuning “Max_Connections”
This setting limits the maximum number of concurrent database connections. We recommend setting it to default, which is variable value. When using a custom value, configure only as many connections as the application actively requires to perform. If you configure a connection limit that’s too high, this can contribute to higher memory usage, even if those connections aren’t being used. An unnecessarily high connection limit can also cause high database connection spikes, affecting performance.
If, however, you encounter connection errors and get multiple “too many connections” notifications in your error logs, you can set this parameter to a fixed value as an alternative to the variable setting. If you choose to assign a fixed value, consider using a connection pool of proxy between the database and the application. This is also advisable if the connections can’t be reliably controlled or predicted.
-
Tuning “Max_Allowed_Packet”
This setting defines the maximum allowed packet size the server can receive. The default setting, which is 4,194,304 bytes, is suitable for this parameter. You should only use a custom value if it’s required by your database workload. You should tune this parameter when dealing with queries returning large elements, such as BLOBs or long strings.
If you set a large value for this parameter, it won’t affect the initial message buffer size. Instead, it lets them grow up to the defined size, if required by your queries. A large parameter value, combined with a large number of concurrent eligible queries, can sometimes increase the risk of out-of-memory conditions.
-
Tuning “Group_Concat_Max_Len”
For the group_concat_max_len parameter, the default of 1,024 bytes is appropriate. You should only use a custom value if required by your workload. This parameter should only need tuning when you want to modify the return of the group_concat statement and enable the engine to return longer column values. This value is best used in parallel with max_allowed_packet, as it defines the maximum size of a response.
When improperly configured, this parameter can cause high memory use and out-of-memory conditions. If set too low, it can cause queries to fail completely.
-
Tuning “Max_Heap_Table_Size”
This parameter limits the size of new user-defined memory tables, but does not apply a limit to existing tables. You can use the default setting of 16,777,216 bytes for this parameter. If this parameter is set too high, it can cause high memory utilization and out-of-memory conditions if in-memory tables expand.
-
Tuning “Binlog_Cache_Size”
The binlog_cache_size parameter controls the amount of memory the binary log cache can utilize. The default setting is 32,768 bytes and is recommended. By increasing the binlog_cache_size parameter, you can improve performance on systems with large transactions by using buffers to avoid excessive disk writes. Cache is allocated on a per-connection basis. To avoid causing an out-of-memory condition, limit this value in environments with a large number of database connections.
-
Tuning “Join_Buffer_Size”
The recommended setting for join_buffer_size is 262,144 bytes, which is the default. This parameter value is preallocated for various types of operations (i.e., joins), and a single query can allocate numerous instances of this buffer. If you hope to improve join performance, try adding indexes to the relevant tables. When you change this parameter, it can result in severe memory pressure in environments with a large number of concurrent queries. Increasing this value doesn’t offer faster join query performance, even if indexes are added.
-
Tuning “Query_Cache_Size”
This parameter is pre-tuned in Aurora and, by default, the value is much higher than the MySQL default. We recommend setting this parameter value to default, which is “variable value.” The Aurora query cache won’t suffer from scalability issues, as the query cache does in MySQL, so it’s acceptable to modify this value to accommodate demanding workloads and ensure high throughput.
Query performance will be impacted when accessing queries through this cache. The output “show status” command under the “QCache” section will show you query cache use.
-
Tuning “Table_Open_Cache”
Leave the settings for table_open_cache as they are, unless your workload requires access to a large number of tables simultaneously. The table cache is responsible for consuming a significant amount of memory, and the default value in Aurora is significantly higher than the MySQL defaults. This parameter will be adjusted automatically according to instance size.
If your database has a large number of tables (i.e., in the hundreds of thousands), this will require a larger setting, because not all tables can fit in memory. If you set this value too high, however, it might contribute to the number of out-of-memory conditions. If the Performance Scheme is enabled, this setting also impacts Performance Schema memory use.

Choosing the Right Aurora Performance Tuning Tool
Aurora performance tuning is a challenging and continuous process. To simplify and streamline Aurora performance tuning, we recommend using SolarWinds DPM. DPM helps provide deep database performance monitoring at scale, without overhead. The SaaS-based platform is built to increase your system performance and team efficiency and boost infrastructure cost savings by offering complete visibility of your databases. DPM supports all major open-source databases, including monitoring MySQL, PostgreSQL, MongoDB, Amazon Aurora, and Redis.
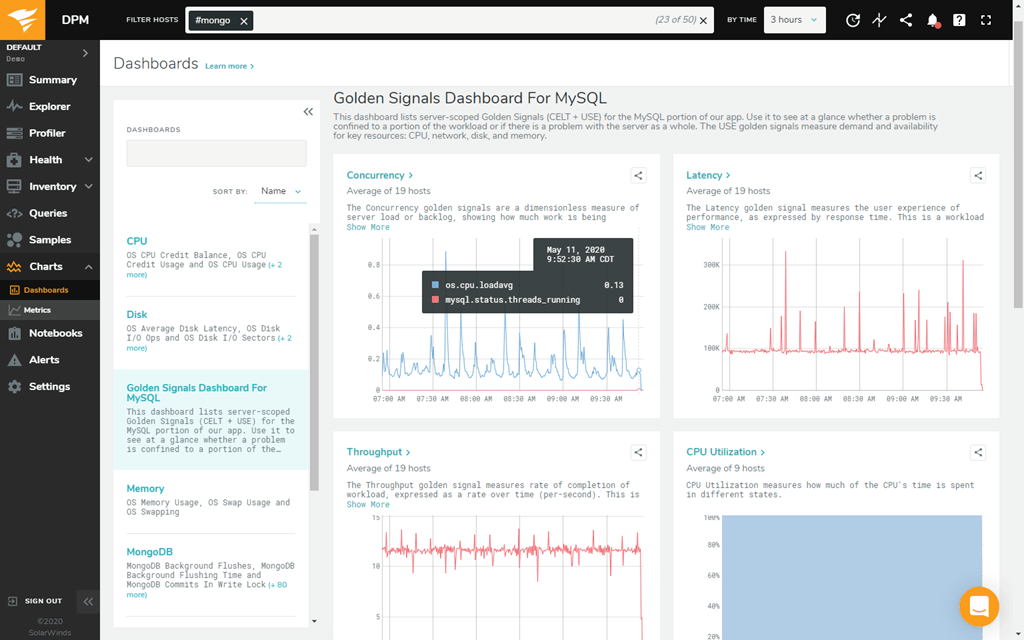
DPM provides 24/7 monitoring, for both real-time and historical analysis. It features one-second granularity, which helps you identify and diagnose small performance problems. With this tool, you can leverage custom side-by-side views to compare databases, queries, and much more.
This tool delivers highly comprehensive database performance analytics, including query samples and explain plans. It offers weekly and daily summary reports and customizable alerts to keep you informed.
The benefits of using DPM are extensive and include the ability to visualize thousands of collected metrics across thousands of databases through easy-to-create and -share charts. Other advantages include shipping better code, troubleshooting and diagnosing outages, isolating unusual behavior, examining performance outliers, and more.
DPM supports physical, virtual, and cloud-based databases and offers a high-security solution for database monitoring. Data is encrypted both in flight and at rest and protected by role-based access control. DPM also offers single sign-on capabilities and SAML integration.
This tool features a simple and easy-to-use interface with an intuitive dashboard layout. Data is represented graphically where possible, giving you at-a-glance visual insight into your database metrics. DPM is scalable, making it suitable for organizations anticipating growth, and is well-supported by SolarWinds. A 14-day free trial of DPM is available.
Getting Started
Although Aurora performance tuning can be a long process, the right tool can significantly reduce the effort involved and help ensure your Aurora database is performing as desired. SolarWinds DPM automates many tuning activities to save you time, alert you to unusual behavior, and give you insight into your databases.