
If you’re working in a large enterprise or business setting, monitoring your network, servers, and workstations is essential for maintaining productivity, reputation, and service levels. With many networks primarily using Windows devices, finding high-quality Windows monitoring tools can be critical. In several companies, it’s not only employee devices using Windows operating systems—in many cases, the servers are running Windows as well.
In this guide, I discuss how even simple Windows server monitoring requires a comprehensive and centralized monitoring system encompassing response times, hardware health, and server and application mapping, along with alerting when these components aren’t performing as expected. I also explore the benefits of having a complete Windows monitoring solution like SolarWinds Server & Application Monitor, which is designed to build a clear picture of how your IT environment is functioning, where your weak points are, and help you resolve issues before they become major problems for your business.
What Does a Windows Monitor Do?
Why Is Monitoring Windows Important?
Best Windows Server Monitoring Tools
How to Choose the Best Windows Monitor
What Does a Windows Monitor Do?
Windows monitoring tools can perform several duties. First, they can check on physical components and baseline performance for servers, applications, services, and networks. After setting accurate baselines, they can notify you when an issue has occurred, whether it be slow database queries, servers not responding, or an application performing slowly.
In addition, by monitoring email and file servers, these kinds of tools can be used as a security measure. They can alert you to a large number of files suddenly appearing or a large number of emails received at once. When these types of unusual behavior patterns appear in any part of your IT environment, monitoring tools for servers and workstations are an important piece of the puzzle in determining what is an issue with a component or device, what is a faulty application or network connection, and what is a security threat.
Why Is Monitoring Windows Important?
Monitoring the performance of your servers and workstations is vitally important for ensuring high performance, maintaining a fast mean time to repair, optimizing servers, and undertaking capacity planning.
An important part of monitoring servers and workstations is to check on the actual physical health of those devices. This includes things like hard drive space, memory use, device temperature, fan operation, and processor loads. A monitoring tool will check more than just these measures, to provide a full and clear picture of your server health and workstation performance. I’ve compiled this guide of the best Windows server monitoring tools to help you find one with all the features you need.
Best Windows Server Monitoring Tools
Below are my top picks for Windows monitoring tools. For the purposes of this list, I’ve focused on premium tools suitable for large business and enterprise use. If you’re a smaller business or only need monitoring for home use, you may prefer free monitoring tools for Windows; however, keep in mind these paid tools are more scalable and offer more robust support than free solutions.
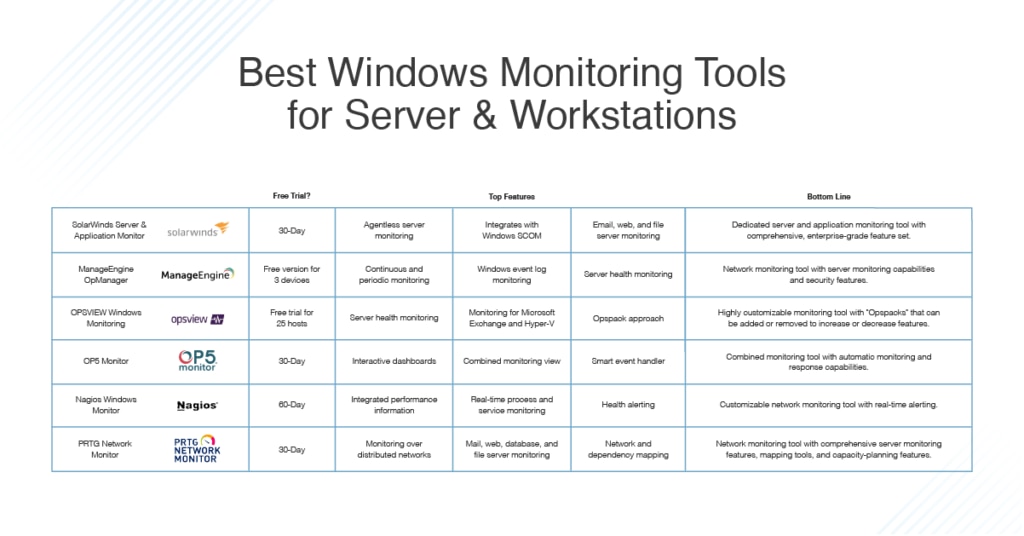
My top choice for Windows monitoring tools for both servers and workstations is SolarWinds® Server & Application Monitor. SAM has several core features making monitoring easy, and you can rely on SolarWinds as an established and well-respected software company in the industry.
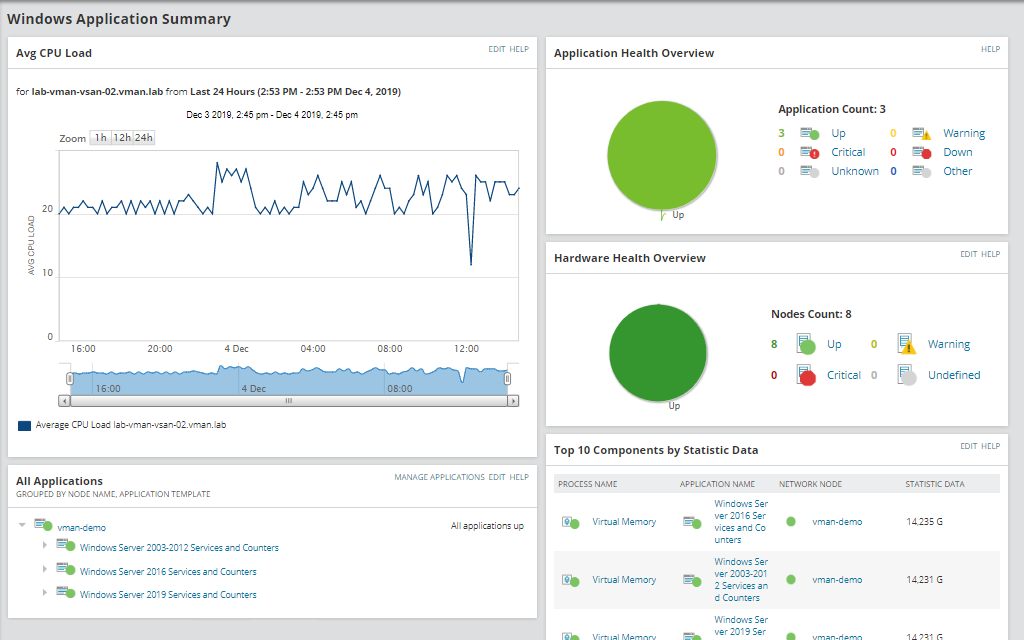
SAM’s key features include application monitoring, server capacity planning, custom app monitoring, application dependency mapping, and Azure monitoring. It also includes Microsoft monitoring and AWS monitoring. Within each of these features, SAM provides several high-quality and effective utilities to help you easily manage all of your servers, workstations, and applications.
One of the great things SAM can do is agentless server monitoring. It can automatically discover and map the elements in your IT environment, and it doesn’t require probes to be installed on remote network devices. This consumes less network bandwidth in general and does allow you to override data collection and install probes where necessary.
In regard to server monitoring software, the high-performing server response time monitors in SAM can allow you to monitor both physical and virtual servers. A number of factors can influence server response time, including CPU load, memory over-utilization, hardware malfunctions, and storage resources running out. For virtual machines (VMs), resource allocation can also be a factor. SAM looks at server response times and provides details on slowdowns, so you can troubleshoot quickly and easily. It monitors application response time, including database performance (and how it impacts applications), and server response time with 1000 templates types for monitoring applications.
SAM uses a comprehensive mapping tool to examine the relationships between your servers and applications, so you can spot dependencies and find problems in network performance possibly affecting server and application connections. It extends the capabilities of Microsoft SCOM to monitor all your third-party applications, as well.
In addition, it includes special monitoring tools for keeping tabs on email servers, web servers, and file servers. This means you can check on all of your website response times, manage sudden bursts of emails, and diagnose storage capacity issues quickly.
General Windows monitoring tools for server hardware and health are also included in SAM, as are tools to help you accurately size your servers, capacity plan, and monitor server uptime. All these features make for a well-rounded server monitoring package, providing comprehensive and centralized information for all of your Windows servers and workstations. With this kind of proactive monitoring, you can keep ahead of problems, addressing them before they affect your end users, and efficiently troubleshoot issues with servers, workstations, and applications.
SAM has functionality beyond server and application monitoring. For example, for Active Directory (AD), it can quickly determine overall AD health and check on replication status. It also allows you to review domain controller roles and statuses.
You can try the full version of SAM for free for 30 days.
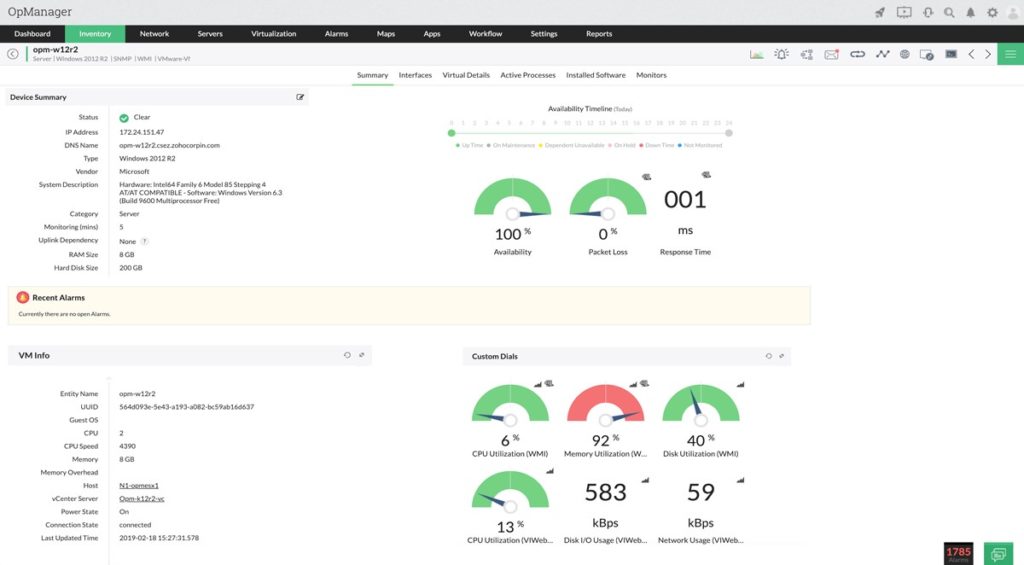
ManageEngine OpManager is another great tool. It can monitor many different kinds of devices, including servers, storage devices, and general hardware and networking components such as switches and routers, firewalls, load balancers, printers, and VMs. This is primarily a network monitoring tool, but it also includes server management features, fault and performance management, storage management, data center management, and several other add-ons which can be used to expand its capacity for other monitoring or management tasks.
OpManager provides several server management utilities to assist with server monitoring, resource management, and performance optimization. It includes multi-vendor support and can monitor servers and applications continuously, as well as all processes and services linking in with them. Alongside this continuous monitoring, it also features periodic monitoring with WMI and SNMP protocols. All monitoring data is stored, so baselines can be established and historic performance trends can be viewed, which can lead to faster troubleshooting and the potential to optimize server performance.
The tool includes general server ability monitoring and server health monitoring and keeps track of critical resources such as CPU and memory usage, I/O rate, disk usage, which processes are running, and network performance and connections. Server performance failures are often due to disk failures, CPU, or memory, and these metrics can be a good indicator as to server health, so you can replace faulty components before they fail and affect end users.
Moreover, OpManager is capable of monitoring virtual machines, VMware ESX servers, and Hyper-V devices, as well as keeping track of guest OS performance when you’re using VMs. For Windows, it can monitor Microsoft Exchange server performance alongside general Windows services monitoring. If a Windows service is found to have failed, OpManager can restart the service, or even the entire server if necessary.
When OpManager looks at the processes running on your server, it monitors details and tracks information, so you can set alert thresholds for issues. You can then manage these thresholds for multiple servers in one centralized location. It also supports remote server monitoring.
Other useful features of OpManager include Windows event log monitoring, which can alert you to issues such as a string of failed logins or bad passwords. This can assist with security planning, making OpManager a useful part of your security approach. It also includes URL and website monitoring, so you can see if your website has been compromised or if there are any problems with your web server. The main downside is OpManager can be deceptively simple-looking, when in fact it comes with a bit of a learning curve. Luckily, there are many helpful videos and documentation online to help you get oriented to the program.
OpManager offers a free version capable of managing up to three devices. The Professional and Enterprise editions monitor up to 1,000 and 10,000 devices, respectively.
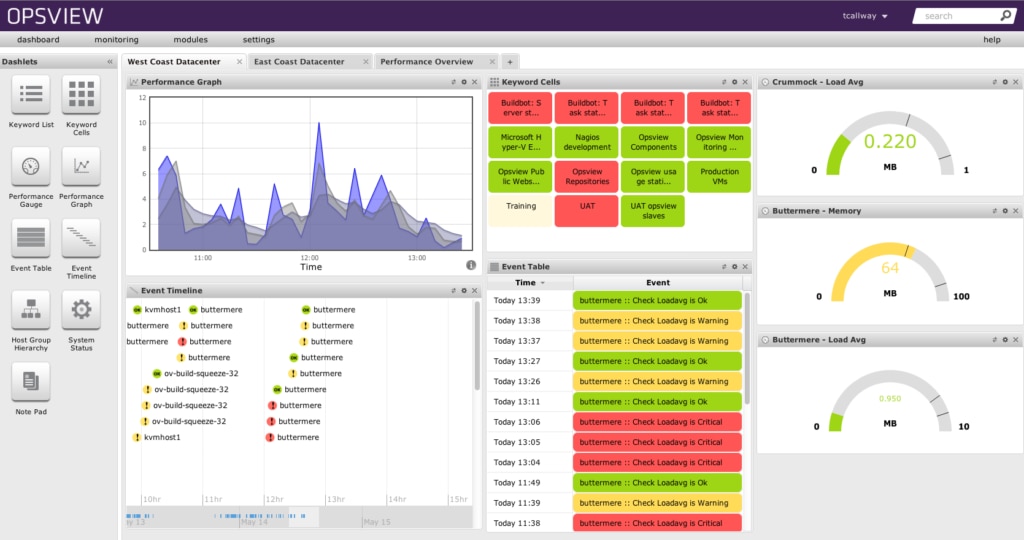
Opsview Monitor is a multipurpose monitoring solution with a range of monitoring and analytics utilities to help you maintain continuous uptime. It uses “Opspacks,” which allow you to highly customize the program—you add only the packs necessary for the particular kind of monitoring you’re looking to undertake. This means you can scale your monitoring easily, expanding it to fit your needs as they change.
The Opsview Windows Server Opspack—the base Opspack—provides monitoring for Windows Server operating systems and includes the ability to monitor physical memory and Windows drives, as well as CPU and disk space. It can monitor Windows event logs, system events, and security and application performance and issues. WMI agentless monitoring keeps tabs on DNS, Internet Information Services, Exchange, and Terminal Services. The tool provides several monitoring solutions for SQL Server, as well as monitoring for a wide range of other databases.
There are numerous other Opspacks targeting different monitoring needs and approaches, so you can pick and choose to suit your requirements. The basic Opsview package includes useful tools and features which work well with any Opspack, such as autodiscovery utilities to map and profile your network, hosts, and services. It offers several dashboards allowing you to drag and drop relevant data in prebuilt templates, so you can highly customize your monitoring view. This can help you to more quickly resolve issues, by tailoring your monitoring solution into one to suit you best.
Opsview offers a free demo and a free trial capable of monitoring up to 25 hosts.
Another piece of server and workstation monitoring software I recommend is OP5 Monitor, which provides combined monitoring for your networks, servers, storage, and applications. It can be used as a monitoring tool regardless of whether your infrastructure is on-premises, in the cloud, or a hybrid setup. Its design is intended to be highly scalable, and quite flexible.
OP5 Monitor has useful and interactive dashboards which can be easily customized, with modifiable drag-and-drop widgets. Maps and graphs provide you with easy-to-understand information about your network, servers, and performance issues relating to your IT environment. The tool can filter input easily, which can help you to group and separate data to get to the information you need for troubleshooting and optimization purposes.
Even if you have multiple data centers, you can combine the monitoring and management of all of them into one view. It’s also easy to add or remove devices, so you can scale up or scale down your environment and monitoring solution as needed.
OP5 Monitor also comes with several features intended to automate the monitoring process. These include an event handler working via smart monitoring, with self-healing capabilities to respond to problems. The tool easily integrates with third-party solutions such as CRM and ticketing systems, and self-provision monitoring. In addition, it performs log server monitoring and integrates event log tracking into the rest of your monitoring solution.
With OP5 Monitor you have access to reports and overviews designed to assist you in providing information on monitoring and management, as well as general environment health, to business leaders or team leaders. The initial setup is typically quick and easy—once you’ve installed the solution you can get going in no time. However, if you have a large setup or a large enterprise, it’ll take a little longer, and some of the behaviors might need tweaking.
You can try OP5 Monitor for free for 30 days with unlimited devices. After the trial period expires, you’ll be limited to 20 devices.
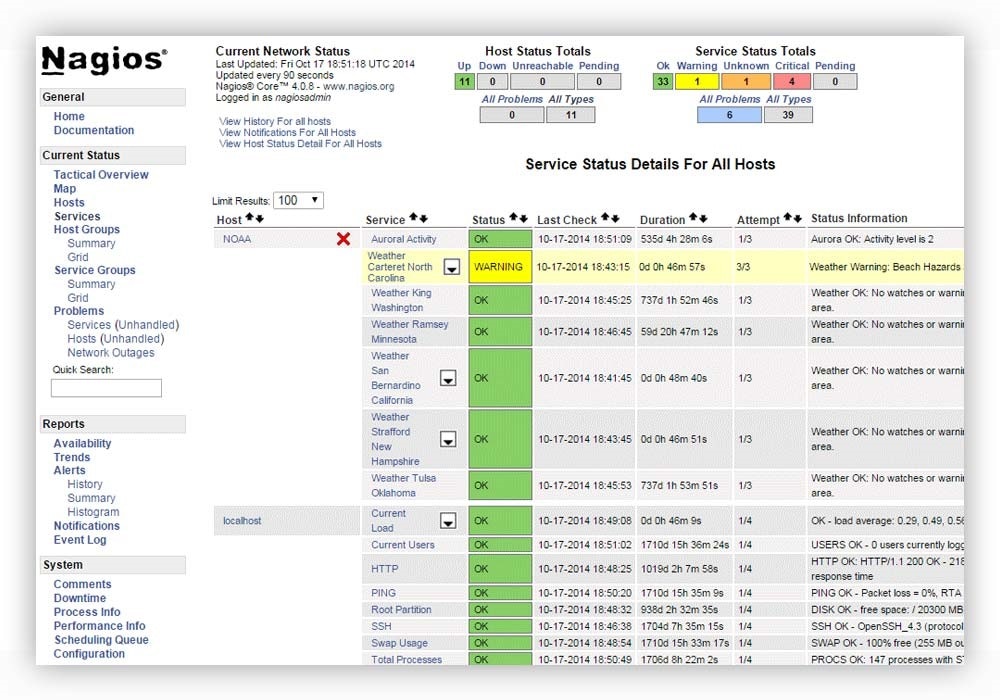
Nagios XI allows you to comprehensively monitor your Microsoft Windows Server operating systems and workstation or desktop operating systems. It can look at several features and metrics for these operating systems, including service and process states, performance counters, application performance, event logs, services, and system metrics. Although there is also an open-source version called Nagios Core, Nagios XI is a more robust and comprehensive solution.
Nagios XI includes a toolset for high-quality and powerful monitoring of server performance. A number of dashboards display integrated performance information, and data on third-party applications and services. This way, you can view everything in one place and more easily keep tabs on the information you need, whether for planning purposes or to troubleshoot issues. And Nagios allows you to fully customize your design, layout, and preferences for each user.
The tool includes capacity planning, optimization utilities, and alerting capabilities, to let you know if there’s an issue with your servers potentially impacting your end users. You can run reports on disk usage so you know when you’re reaching capacity, and you can set alerts based on CPU trends and RAM utilization. You can also choose to be notified if any adaptors are handling larger or unexpected bandwidth, so you can resolve those issues before they affect your end users.
For processes and services, Nagios XI can perform real-time monitoring, so you can see whether they’re running, or whether a process is running too many instances. It allows you to increase the availability of your servers, applications, and services, and will quickly detect network outages, failed services, or protocol failures.
Although Nagios IX is a great tool, the setup takes more time than others on this list, and the UI could use some work. Its customization capabilities, while impressive, also have the potential to overwhelm. This is a tool built for engineers, so for a less experienced user, the learning curve may be too steep.
Nagios XI offers an online demo and a free trial.
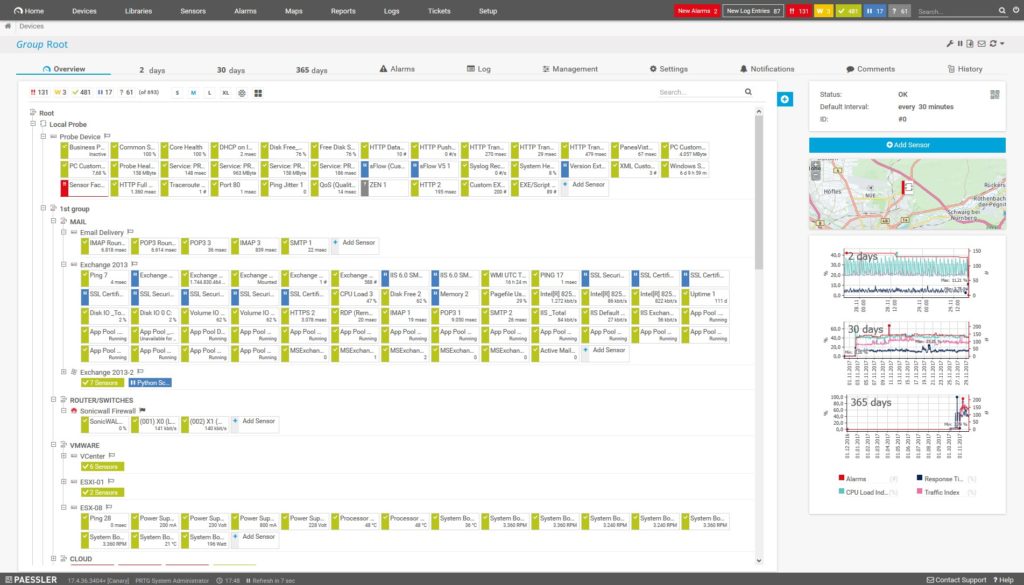
The final tool I recommend for monitoring Windows servers and workstations is PRTG Network Monitor, by Paessler. It undertakes continual tracking of server performance, disk space, uptime, and general server health, to ensure downtime is minimized and performance is maximized.
PRTG can monitor a wide range of servers, including those in distributed networks. This is quite useful for larger enterprises with significant network spread. The tool uses sensors to monitor various device performance metrics, such as switch port traffic, disk space, and CPU load, and then combines those metrics to gain an overall picture of how a device is functioning. It also monitors virtual servers, which is useful in allocating and using virtual resources. And when it comes to remote monitoring tools, Windows users would do well to consider PRTG, as all of its interfaces allow remote and local access.
Mail server monitoring with PRTG covers IMAP, POP3, and SMTP protocols, to ensure mail server issues are minimized. With web server monitoring, PRTG tracks website performance, ensuring your websites don’t go down unexpectedly—or, if they do, you can resolve the issue efficiently. Finally, database and file server monitoring lets you keep an eye on MySQL, Microsoft SQL, Oracle SQL databases, and your storage area network and network-attached storage. This means all of your files can be accessed quickly, and applications and services won’t crash due to database or unresolved server issues.
PRTG provides real-time monitoring, alerting you to issues as soon as they arise and preserving availability, capacity, and general uptime. It helps to ensure stability of your network and services, which means you’ll have more confidence your services are reliable, and your service levels will remain high for your customers. You can use PRTG to map your networks and dependencies to easily visualize your network, servers, and devices.
With historic data and analysis of this information, PRTG can also give clues as to declines in your server and workstation performance, equipping you to engage in capacity planning or to replace components or devices. Its server monitoring utility shows you which capacities will need to be increased in the medium or long term.
PRTG offers an unlimited free trial for 30 days, which reverts to a free version with limited functionality when the trial is over.
How to Choose the Best Windows Monitor
There’s a wide range of monitoring software for Windows on the market, making it difficult to determine which is right for your business. The tool you ultimately choose will depend on the services your business performs, and the versions of Windows you’re running on your servers or workstations. For example, when it comes to performance monitoring tools, Windows Server 2008 might be harder to suit, as it’s an older release of this operating system.
Taking all of this into account, my top recommendation for server and workstation monitoring software is SolarWinds Server & Application Monitor. It has a huge feature base, with several high-quality Windows monitoring tools to help you keep track of your server and workstation performance. It includes monitoring for email, web, and file servers, and it links in with Windows SCOM to keep track of your third-party applications on all your workstations. With a free trial, you can demo SolarWinds SAM to see if it’s right for you.