
As your business grows, so will the number of people accessing your network and confidential data. The fast growth of new devices connected to your system can cause problems and outages.
This is where network visibility can be a lifesaver. Having complete control over your entire online system can help you eliminate blind spots, performance issues, and that your network works optimally.
In this post, we’ll take a closer look at network visibility and show you how to monitor the performance of your network using powerful visualization tools.
Why Network Visibility Is Important
Large organizations typically have complex networks with multiple data centers and several connected devices. As such, it may prove difficult to ensure every aspect of your system is running smoothly.
Network visibility enables you to keep track of everything going on in your network. For instance, you could use this strategy to monitor bandwidth usage and track traffic from one node to another. You’ll also be able to keep tabs on the devices connected to your system.
This level of control over your network comes with several benefits. For starters, it makes it easier to diagnose technical issues. With network visibility in place, you can quickly identify the sources of problems and resolve them remotely.
This strategy also facilitates better application performance monitoring. For instance, you can monitor every relationship in your network. Then, you can use metrics and other data to improve the end-user experience.
Network visibility can also help you prevent potential threats and problems. With the right tools at your disposal, you’ll be able to detect unauthorized traffic and block suspicious activity in your system before it’s too late.
Why You Should Consider Using Network Visualization
The most effective way to achieve network visibility is by using network visualization. This visualization process typically involves creating visual depictions of your entire system, using elements such as paths, data points, and devices.
For example, you could generate graphs or charts of your network using link analysis software:
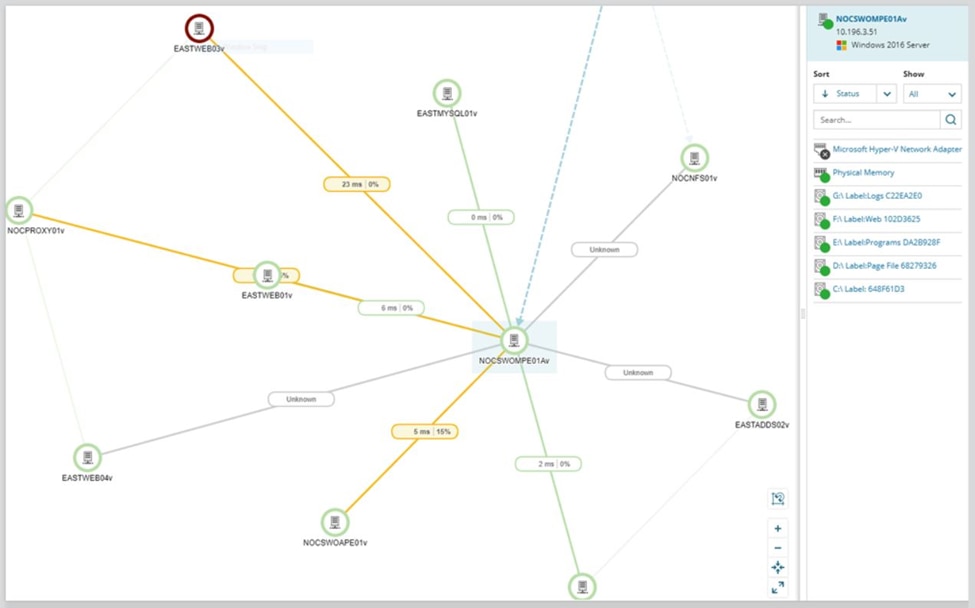
There are several benefits of using visualization to monitor your network. Unlike spreadsheets, inventory lists, or text-based reports, visuals like maps and graphs make it easier to digest and understand data.
Visualization can also be handy when communicating network issues to people with little or no technical knowledge. It’s akin to viewing a real-time weather map as opposed to reading descriptions with unfamiliar jargon.
Furthermore, looking at a visual representation of a network can help you to locate issues more efficiently. It enables you to see where the problem is stemming from, what’s potentially causing it, and the impact it has on other devices in your system.
Network visualization also enables IT teams to gain real-time insights into the infrastructure of your network. This, in turn, helps them perform required actions, such as troubleshooting, more efficiently and effectively. It also gives them greater flexibility when it comes to working with complex data points.
How to Monitor Your Network Performance With Network Visualization Tools
Network visualizations tools offer interactive ways of identifying performance issues in your system. You can also use them to show vulnerabilities that can compromise your data. These tools can also help you monitor data flow from different devices and nodes in your network. Moreover, you can use them to track your uptime and map your Wi-Fi signals.
To work correctly, visualization tools will require access to your database and cloud storage platform. They’ll then use the data in these sources to map your network in clear and accurate graphs or charts.
Let’s look at an example of a network visualization tool you can use for your system.
SolarWinds Network Performance Monitor (Free Trial)
SolarWinds® Network Performance Monitor (NPM) comes with several visualization tools to help you get started with network visibility and monitoring. It includes SolarWinds NetPath™, which was built to provide users with deeper insights into critical network paths.
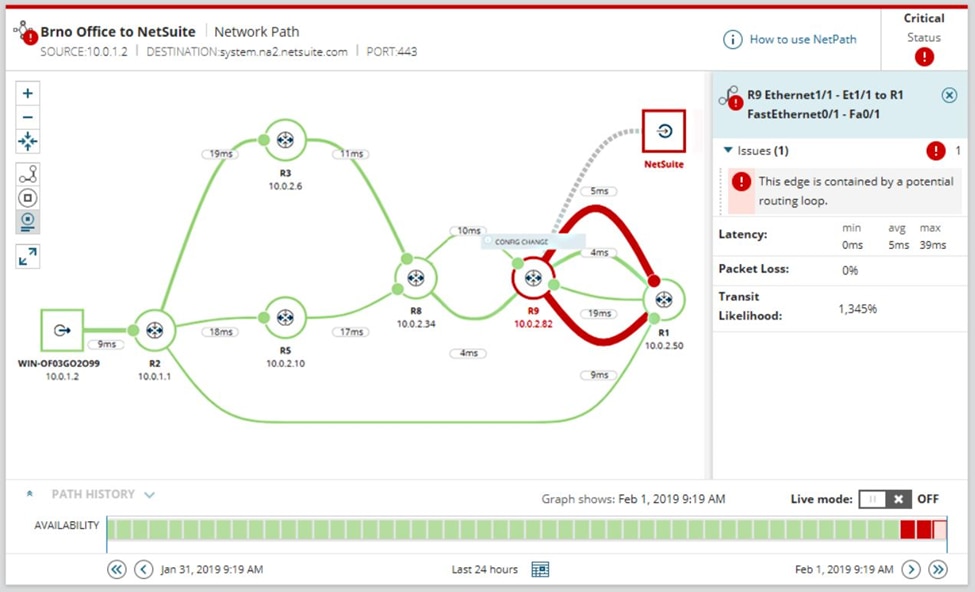
This tool is particularly effective when it comes to mapping hybrid IT environments. It enables you to see all devices, applications, and networks in a single-page view, so you can isolate and resolve problems more quickly.
NetPath also helps you improve the end-user experience. It does this by flagging outages and showing the location of technical problems along the network path. With this data, you’ll have time to resolve these issues before they can reach your users.
Network Visibility Conclusion
Network visibility helps large organizations troubleshoot technical issues more efficiently. It also enables companies to better monitor the devices and applications connected to their systems. As such, it can prevent potential security breaches and other threats.
Powerful visualization tools such as interactive graphs and charts can make it easier for IT teams to manage complex networks. For example, SolarWinds Network Performance Monitor enables you to create custom maps and network diagrams for your company. You can then use them to assess the performance of your online system. Check out the free NPM trial—it’s fully functional for 30 days.