
Websites have become a very important part of almost every business. They increase the reach of your business to a wider audience because anybody with an internet connection can access it. When the reach of your website is so long, there’s no room for anything that could leave a negative impression.
Along with the kind of product or service your organization provides, features, and price, your website performance leaves a lasting impression on customers and potential customers.
In this blog post, I’ll provide an end-to-end explanation of web performance monitoring by explaining what it is, why you need it, and how to go about it. Let’s start with understanding what web performance monitoring means.
What Is Website Performance Monitoring?
History of Websites
Websites have taken a long road. When people first realized websites increased their reach, every organization started building one for themselves. In the beginning, there were mostly only static websites where the content was fixed. They mostly consisted of text with some images. When everybody started creating such websites, some thought of beautifying their sites to make them better than others. They used better designs and templates than their predecessors.
People wanting to make their websites even better led to dynamic websites with custom data. Soon organizations had complex websites that were both beautiful and showed custom data.
The Problem With Complexity
While building complex websites worked to impress the audience, it led to another problem: complexity can slow down a website, negatively affecting the user experience. Nobody likes to wait. But you cannot go back to using basic websites that load faster.
The Solution
Organizations had to figure out how to improve the performance of their websites, starting with understanding why it was slow in the first place. Monitoring a website to pinpoint slow performance is called web performance monitoring.
When you use a website, you interact with the application via a web browser. Whenever you perform an action on the website, a request goes to the server, and the server returns a response. The cause of the slow speed of your website can be anywhere in this process. In web performance monitoring, you look at different components of your web application and try to understand what’s leading to the slow performance. Once you figure out what’s making it slow, you can work on fixing the issue.
Why You Need Web Performance Monitoring
The goal of web performance monitoring is to make sure your web application is both impressive and fast. You can figure out if your website’s impressive by tracking the impact your website is making on your business and through visitor feedback.
Finding error-free website performance is rarely the case. When it comes to web performance improvement, there’s always an opportunity to make your web application faster.
How can you find out what changes to make to improve the website’s performance? You can discover the answer by monitoring your website. This is where web performance monitoring comes in. Web performance monitoring can tell you exactly how your website is performing, if there are any bottlenecks, and what’s causing them. And finally, you’ll be able to make changes to improve performance.
What to Monitor
You won’t know what the problem is if you don’t know where to look. A website has a lot of components. The first thing you need to know is where there might be a problem that can lead to performance issues, then what to monitor.
Where Does the Issue Lie?
Heavy JavaScript and Styling
JavaScript is a programming language mostly used to build websites. This code is responsible for what happens when you click a button, what happens when you click an image, what happens when you enter details and submit them, and more.
When a website loads, it has to load all the JavaScript required to make the website function properly. This takes time. And when you’ve written JavaScript without optimizing it, it creates delays in the website and leads to performance issues.
Similar to JavaScript, CSS is often used to add styling with coloring, buttons, forms, headers, footers, etc. And like JavaScript, CSS has to be loaded completely before the website looks the way it was designed to look. When CSS isn’t optimized, it can also cause delays that result in slow websites.
In general, poorly written code can cause slow websites. This is also known as render blocking.
Sudden Traffic Hike
When you own a website, you’ll know about how much traffic you get per day or per month. And you’ll have configured your web application to handle that amount of traffic. But there might be times where there’s a sudden hike in traffic. Let’s say you own an online shopping website. During the peak holiday shopping season, you might give out amazing offers and discounts to your customers. As more and more people learn about your offer, more people will interact with your website. This leads to a sudden hike in traffic. And if your web application isn’t configured to handle it, it will lead to performance issues.
Unoptimized Images
This is a common problem on websites with a lot of images. Again, let’s consider an example of an online shopping website with product images. Even with a small business, you may have to deal with thousands of images.
Whenever an image has to be displayed on the website, the browser sends a request to the server to send the image. The server sends the image and renders it in the browser. If the images aren’t optimized, it takes more time to fetch them and render them in the browser. This causes performance problems.
Unclean Code
Your web application needs meaningful code to function properly. When I say meaningful code, I mean code with proper syntax. When developing a web application, you might add unnecessary white spaces—blank lines to make the code easily visible. If you’re working with other developers, you might add comments to your code, so others can easily understand it. All these white spaces, blank lines, and comments are of no use to the website, but because they still exist, they might cause performance issues.
Bad Hosting and CDN
When you have a website, you have to host it. You may host it on your own server or use a hosting provider. If the hosting provider’s server isn’t optimized, it can lead to performance problems. You might also run into trouble if you aren’t using a content delivery network (CDN).
A CDN is a network of geographically distributed servers or proxy servers. Your website will probably have a diverse audience with customers all over the world. Using a CDN helps provide service to your customers using the best performing and highly available server at any given time. If you aren’t using a CDN, one server will have to carry all the load, which can cause trouble.
Third-Party Plug-Ins and Scripts
Plug-ins add an extra load onto your web application. And when there’s an extra load, your website may be slow. The same applies when you use third-party scripts. If you have integrated a third-party script, whenever an action triggers the script, the request is sent to the third-party server. The third-party server processes the request and sends the response back. This process can take time and result in performance issues.
These are some of the common reasons for slow websites. But they’re not the parameters you need to monitor. Let’s look at what you do have to monitor to understand how your website is performing.
Performance Metrics to Monitor
You need metrics to measure anything. The performance of your websites can be analyzed using the following metrics.
Page Load Time
Page load time is the average time taken for a page to load. When you click on a URL, your browser sends a request to the server to deliver the page. Your server sends a lot of data including, texts, images, design, etc. Page load time represents the time taken for the website to completely load from the time you first clicked on the URL. This metric helps you understand the speed of your server and if you’re passing unoptimized elements from the server to the web browser.
Time to Title
This is the time it takes for the title of the website to load from the point in time when you first requested for the website. The title of the website is the text you see in your browser’s tab associated with the website. Faster time to title helps the user understand the website they have requested is legit. This is very helpful when you have a website with heavy elements and would take more time to load. Faster time to title can convince the user to wait for the complete page to load.
Time to Start Render
Time to start render, also known as start render time, is the time it takes for the website to load the first element visible to the user from the moment the user first requested the website. This element can be text, a heading, background color, a header, a footer, etc. In complex and dynamic websites, all the elements of the website aren’t loaded and displayed at once. They are rendered in parts for various reasons. Faster start render time lets the user know there are elements loading, which results in the user being more willing to wait for the complete page to load.
Bounce Rate
The bounce rate represents the percentage of users who leave your website without clicking on anything after the first page they land on. Suppose somebody searches for something on Google, and Google shows your website in the results. Then the user clicks on your website’s link and comes to your website. If the user leaves your website after visiting this first page, it adds to the bounce rate. It’s not considered bouncing if the user navigates to different pages on your website.
Bounce rate is an indication of website quality. It shows that the user might not have liked your website or the website wasn’t helpful to the user. Monitoring bounce rate can help you understand which pages to work on for quality and user satisfaction.
Error Rate
Error rate is the percentage of requests that contain errors. It’s calculated as the average number of problematic requests compared to the total number of requests. The error rate helps you understand the conditions when your website isn’t functioning as expected.
Error rate can be especially helpful if you want to understand how your website will perform if there’s a sudden traffic hike. As mentioned earlier, there can be times where you might get sudden hikes in traffic, like during the holidays. Use load testing on your web application to see how it will behave by monitoring the error rate and help you determine if you need to reconfigure your website to handle the hike in traffic.
Time to Interact
The time to interact is the amount of time a website takes before a user can interact with it after first accessing it. You’ve probably noticed you can’t always interact with a dynamic website immediately after it begins loading. These kinds of websites take some time to load all the elements and completely render everything before you can enter something in a text box or click a button. The time to interact gives you an idea of how long your website makes users wait.
Requests per Second
Requests per second, as the name indicates, tells you how many requests are being sent to the server each second. Whenever there’s an action on the website, a request is sent to the server to process it. A request can be for HTML pages, images, media files, database transactions, API calls, and so on. Each request takes some time to process. The greater the number of requests, the more time required for processing. Requests per second can help you optimize your website by properly planning the requests.
Overall Weight
Overall weight is the total number of bytes received by the user’s web browser from the web server. Everything in a web application—HTML pages, images, and media included—is basically data. Whenever a web application is used, data is transmitted. The performance of a website hugely depends on the amount of data being transmitted.
When the amount of data being transmitted is more, the transmission requires more bandwidth and more time. Monitoring the overall weight will tell you if there’s unnecessary data flowing between the client and the server. This in return can help you optimize your application.
Connection Time
Connection time is the amount of time it takes the web browser or client to establish a connection with the web server from the time the web application is first requested. Monitoring the connection time helps you understand the site’s network performance. There can be a lot going on in the network between the client and the browser. Monitoring the connection time can tell you if the network is causing a performance problem.
Knowing the connection time can also help you understand how your website will behave if there’s a sudden spike in the number of requests. This will tell you if you need to optimize the network to improve your website’s performance.
How to Monitor Website Performance
The two most common approaches to website performance monitoring are real user monitoring and synthetic monitoring.
Real User Monitoring
Real user monitoring tells you how your website performs when real users interact with it. This gives you a precise result because the results are based on actual interaction with your website’s users. With real user monitoring, you can see if and where your users experience performance problems. This will help you prioritize the fixes with the biggest impact on the user experience.
Real user monitoring is done by adding a script to the elements users interact with. For example, users usually interact with buttons and forms, so you’ll want to add a script there. Whenever a user interacts with the website or a particular part of the website, the script is triggered. This script then captures or records whatever data is required to monitor the website’s performance.
Synthetic Monitoring
Synthetic monitoring doesn’t require real users. When you take the synthetic monitoring approach, you simulate real users. Basically, you write scripts to simulate real user behavior using automation frameworks like Selenium. Then when the simulator interacts with the website, performance metrics are recorded. Synthetic monitoring is usually done in the development branch and not in the production branch.
One advantage of synthetic monitoring is the quick results. You won’t have to wait for a large enough number of users to interact with the website. You can run different simulations in a short period of time to get the results you need. But you can’t rely completely on these results. A simulation only includes what you think your users might do. Users might interact with your website in ways you don’t expect.
So now you understand the different approaches. But how can you implement web performance monitoring?
Use a Tool to Make It Easy
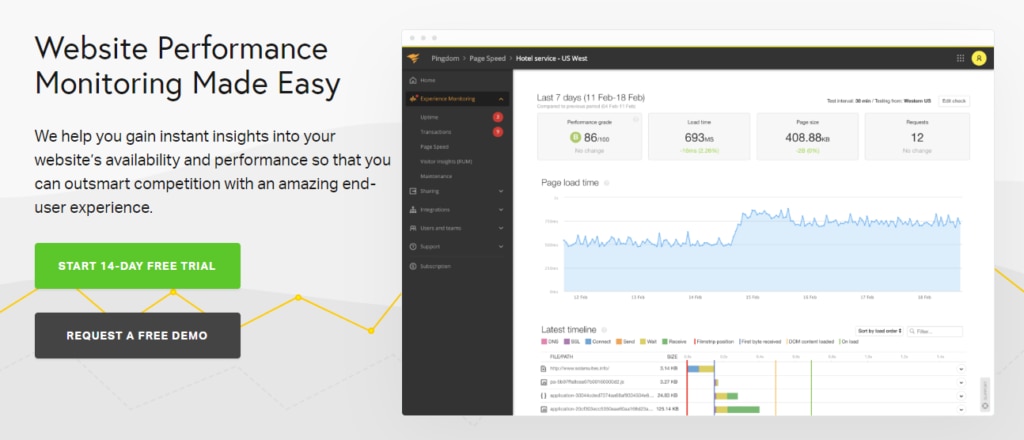
The best way to monitor web performance is by using a tool. One of the best tools I’ve come across is SolarWinds® Pingdom®, which provides various features including real user monitoring and synthetic monitoring. Pingdom analytics can help you understand the recorded metrics better and give you crucial insights you can use to create amazing experiences for your users. You can sign up for a free trial here.
This post was written by Omkar Hiremath. Omkar uses his BE in computer science to share theoretical and demo-based learning on various areas of technology, like ethical hacking, Python, blockchain, and Hadoop.