
For network IT admins, network diagrams can be invaluable, as they offer a quick visual overview of the IT environment. But what type of map is more useful, a logical network diagram or a physical network diagram? It’s useful to understand the merits of both, though for most admins, logical network diagrams are the more common choice, as they offer a look at the flow of data in the network.
Whether you prefer to use a logical or physical network diagram, it’s worthwhile to find a way to automate the diagramming process as much as possible.
If you’re looking for physical or logical network diagram software, look no further than SolarWinds® Network Topology Mapper (NTM), my top choice for streamlining the network mapping and diagramming process, from discovering devices and scheduling scans to customizing visual elements and sharing maps with your team.
- Logical and Physical Network Diagrams
- The Benefits of Network Diagram Software (+ Recommended Tool)
- Start Enjoying the Benefits of Logical and Physical Network Diagrams
The Basics of Physical and Logical Network Topologies
Diagramming networks accurately relies on understanding the underlying topologies. Topologies describe the layout of elements in a network and the connections between them. There are a few main types of network topologies, which can apply to both physical and logical network layouts.
While the topic is thoroughly covered in other articles, it’s worth reiterating the basic topology types. A star topology arranges nodes around a central hub. In a bus topology, devices are arranged along a line, with data flowing in one direction. In a ring topology, each node is connected only to the ones on either side, so data flows in a circle. Other possible topologies include dual-ring, which allows data to flow two directions in a circle, a tree topology with a branching structure, and a mesh topology where individual nodes are connected to multiple other nodes. Each of these topologies has its advantages and disadvantages in terms of data flow, efficiency, cost, and other factors.
As is further explained below, in the case of physical network topology, the “connections” between network elements refer to physical cables. But in the case of logical network topology, the connections between the nodes refer to data flow, which does not necessarily follow the cabling. For this reason, a network could technically have one underlying physical topology describing the cable connections, and a different logical topology describing how data flows between devices, which is why it’s important to clarify which type of diagram, physical or logical, you want to create and use.
What Is a Physical vs. Logical Network Diagram?
Network diagrams are the schematic representations of the underlying physical or logical network topologies. These diagrams consist of nodes and lines, with different icons to make it easy to quickly see different elements on the network. Diagrams can range from hand-drawn maps to automated, highly customizable software diagrams, but regardless of how sophisticated the diagram is, it’s important to understand whether you want it to refer to physical topology or logical topology.
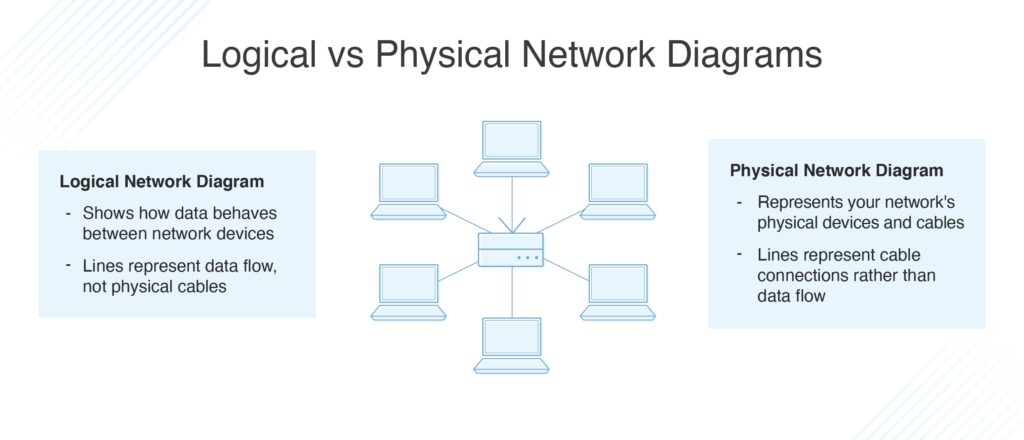
Physical Network Diagram
When you map your physical network topology, the focus is on the physical devices and the cable connections between them. A physical network topology diagram will include icons of elements like workstations, servers, routers, and switches, while the lines between these elements represent cable connections. In a sense, this is the most “accurate” representation of your network, as you’re portraying how the actual elements are laid out and connected in a material sense. However, this isn’t necessarily the most useful type of diagram to create. Often, it’s more important to understand how data is transmitted between devices and how data behaves in your network, which doesn’t necessarily match the underlying physical layout.
Logical Network Diagram
Logical topology diagrams are focused on the way data connections work across the computer network and can reveal how devices communicate with each other. While the diagram will include similar nodes as seen in a physical network diagram, like servers, routers, and switches, the lines represent data flow rather than physical cabling. Admins may create multiple logical network diagrams, including maps to describe their WAN, LAN, AWS, Cisco, and other environments. These diagrams may be highly detailed or provide a high-level overview. With these diagrams in hand—and especially with diagrams showing up/down status alerts—admins gain a better understanding of network layout and performance and can identify problem spots more quickly.
The Purpose of Physical and Logical Network Diagrams
Admins may choose to leverage depictions of their networks for several key purposes:
Network Maintenance and Management
For network admins, the advantages of an automated network diagram, and especially a logical network diagram, are clear. Admins can run device inventory, get a visual overview of their environment, see which nodes are up or down, and see how their infrastructure operates under various loads. With a clear sense of network topology, they can better see how various adjustments, like adding devices or creating network segmentation, may impact performance.
Troubleshooting
When problems occur, admins need fast insight into what is causing the bottleneck. With a logical network diagram designed to display up/down status, admins can take a visual scan of the network, easily see where the problem is occurring, and even understand how it could impact related nodes. When admins can pinpoint problem devices, it helps reduce overall troubleshooting time.
Compliance
Network diagrams can be critical for proving compliance with key regulations, such as PCI, that may require specific, secure architecture. For instance, admins can use diagrams to get a visual understanding of what nodes are and are not within the scope of particular regulations, then protect those nodes as needed. Logical network diagrams are especially useful here, as regulations typically govern flows of sensitive data.
Inventory Management
Either a physical network diagram or a logical one is appropriate for inventory management purposes, though diagramming software with automated logical and physical network topology discovery—including discovery of your routers, switches, connections, and more—is best for ensuring accurate inventory. A diagram provides a visual overview of inventory, with illustrated icons, to make it easier to see the scope of your network.
The Benefits of Network Diagram Software
In the past, network engineers have had to manually draw network diagrams, often using Visio, and redraw them when they changed. For a large or dynamic network, this would quickly become a difficult or impossible task. Today, network diagramming software provides automated ways to create network diagrams and keep them updated, while providing real-time network insights to help with troubleshooting.
If you’re looking for an effective, user-friendly solution for automated network diagramming, try SolarWinds Network Topology Mapper (NTM). It offers a streamlined interface and a low learning curve, so you can get started mapping right away. Create the network diagram you need, including logical connections like switch to switch, switch to node, and switch to router port connections.
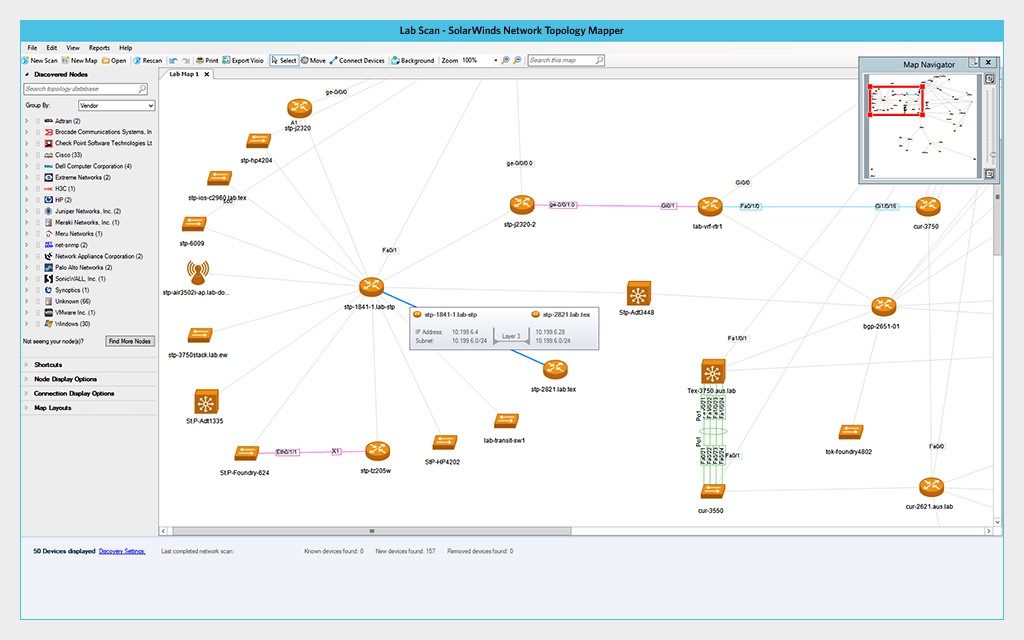
With NTM, you can automate the device discovery process across your LAN or WAN. NTM is designed to discover your nodes through means like SNMP v1-v3, WMI, ICMP, CDP, Hyper-V, VMware, and more. It’s also designed for multi-level network discovery, so you can generate OSI Layer 2 and Layer 3 network maps. You can also connect devices manually as preferred.
You can choose to schedule scans to run regularly, though NTM is also designed to auto-detect updates to your network infrastructure. For greater efficiency, it’s also possible to use a single scan to build many maps.
Once your network devices are discovered, NTM offers the tools you need to customize your diagram’s visual elements as little or as much as you want. NTM comes with out-of-the-box layouts and templates designed to make it easier to build the maps you want quickly. It also allows you to drag and drop or resize elements, customize their appearance, and otherwise create the visual look you prefer.
Once your maps are created, NTM makes it easy to put them to use. You can export the diagrams to Visio, PDF, or PNG formats, and schedule exports of updated maps to your Network Atlas tool, making it easier to share maps with team members or auditors as needed. SolarWinds offers a 14-day, fully functional free trial, so you can play around with it and see if it works for you.
Start Enjoying the Benefits of Logical and Physical Network Diagrams
If you’re interested in creating and using network diagrams, your best bet is to automate the process as much as possible. You’ll get automatic discovery and updates, status insights to make troubleshooting easier, and visual customization options. To get started today, I suggest trying SolarWinds Network Topology Mapper.