If you know your network’s throughput and bandwidth levels, you have valuable information for assessing network performance. Throughput tells you how much data was transferred from a source at any given time, and bandwidth tells you how much data could theoretically be transferred from a source at any given time. Knowing how both are performing is crucial for administrators hoping to get a clear picture of their network’s performance. As always, there’s software available to potentially make this process easier and quicker.
What Is Throughput in Networking?
5 Best Tools for Monitoring Bandwidth and Throughput
- SolarWinds Observability Self-Hosted (Free Trial)
- Network Performance Monitor (Free Trial)
- Manage Engine NetFlow Analyzer
- Paessler PRTG Network Monitor
- Remote Monitoring & Management (RMM)
- Additional Tool: NetFlow Traffic Analyzer (Free Trial)
Below, I’ll touch on some other helpful tools if you’re interested in throughput visibility. Pretty much all of the products I mentioned have free trials available, so you can give them a try if you want to put my recommendations to the test. I also provide a comprehensive review of one of the leading network throughput solutions on the market—SolarWinds Observability Self-Hosted—and I explain why this duo of tools is my “best software” pick.
So, what are throughput and bandwidth? What’s the difference between them, and why do they matter? The short answer is speed. Speed is one of the most important things used to measure network performance, and we use throughput and bandwidth to measure it. How fast packets or units of data travel from source to destination or sender to recipient determines how much information can be sent within a given timeframe. Slow network speed equals slow network speed within applications, which equals laggy applications. Throughput and bandwidth can be used to measure an application’s speed—and administrators need this information to make improvements to their networks.
What Is Throughput in Networking?
So, how do we define throughput? Again, network throughput refers to how much data can be transferred from source to destination within a given timeframe. Throughput measures how many packets arrive at their destinations successfully. For the most part, throughput capacity is measured in bits per second, but it can also be measured in data per second. Packet arrival is key to high-performance service within a network. When people use programs or software, they want their requests to be heard and responded to in a timely fashion. Packets lost in transit lead to poor or slow network performance, and low throughput indicates problems like packet loss.
Using throughput to measure network speed is good for troubleshooting because it can root out the exact cause of a slow network and alert administrators to problems, specifically in regard to packet loss. Packet loss, latency, and jitter are all related to slow throughput speed. Latency is the amount of time it takes for a packet to make it from source to destination, and jitter refers to the difference in packet delay. Minimizing all these factors is critical to increasing throughput speed and data performance.
How to Optimize Throughput
By far the most important thing to do when optimizing throughput is to minimize network latency. Latency slows down throughput, which, in turn, lowers throughput and delivers poor network performance to users. Generally speaking, you want to minimize lag by monitoring endpoint usage and addressing network bottlenecks.
The most common cause of latency is having too many people trying to use a network at the same time. Latency gets even worse if multiple people are downloading simultaneously. If you’re an IT manager, looking at endpoint usage can tell you which employees are causing latency with non-work-related applications. Even if you’re not an administrator and looking at this from a productivity standpoint, it’s also helpful to know what apps are gumming up the work.
Either way, information leads to action. Network bottlenecks are the IT equivalent of traffic jams. Traffic gets congested for various reasons throughout the day and slows the network’s performance. For example, network performance is typically slow after lunch in large companies because people are returning to their workstations. You can address bottlenecks in many different ways, starting with upgrading routers to keep up with traffic. You can also reduce the number of nodes your network uses, as this will shorten the distance packets travel, potentially reducing congestion. Here are some other tips for reducing latency.
1. Use a Wired Connection
Wireless connections can get “lost” because they’re sent through the air. When this happens, servers have to send the information repeatedly, causing a delay. You can strengthen your wireless signal, but latency is still bound to happen because all wireless signals have this problem to varying degrees. Using an Ethernet cable is a cheap and easy way to improve your connection. Updating to a fiber-optic network is also an option.
2. Reboot Your Network
Haven’t turned off your network hardware in a while? It may be causing lag. Unplug the router and modem, wait a few moments, and reboot.
3. Close Applications Using Up a Lot of Bandwidth
All network connections have limited bandwidth, and latency will increase if you’re using more than your fair share. Ease up on those bandwidth-intensive applications.
4. Disable Your Firewalls
This may sound like an odd suggestion at first, but let me explain. Firewalls filter all incoming and outgoing network traffic; a corrupted firewall can slow your network down. The same will happen if you run multiple firewall programs simultaneously because they all strain your network tremendously. Disabling the firewall can help you figure out if this is a significant factor in your current slowdown.
5. Go Around Faulty Network Hardware
Sometimes, lag is caused by faulty hardware. You can try working without specific equipment to see how it affects network speed. The process of elimination will reveal what network hardware, if any, is responsible for latency.

6. Call in Reinforcements
After you’ve run a speed test and checked for packet loss, it may be time to contact your internet service provider. The problem could be on their end. Keeping tabs on your network throughput isn’t just about troubleshooting slowdowns. Effective throughput monitoring, with or without tools, can help identify potential issues, compare real-world performance to a service-level agreement (SLA), revitalize network design and planning, and create a baseline for analysis.
Skip to “Best Tools for Monitoring Bandwidth and Throughput”
How Is Throughput Measured?
There are several tools you can use to measure network throughput.
Network Monitoring Tools
One of the most detailed and accurate ways of measuring network throughput (and network performance) is using network monitoring tools. By monitoring different metrics, data packets, and network traffic, these tools provide insight into your network performance, allowing you to understand network throughput patterns and identify bottlenecks.
Speed Testing Websites
Speed-testing websites also make it easy to measure throughput in networking. Using a download and upload process, these websites determine the time it takes to transfer data and display the results in Mbps or Gbps.
Iperf
Another way of measuring network throughput is with Iperf, a command-line tool that sets up a client-server connection and generates network traffic to test throughput. It then provides a detailed report on the throughput as well as other metrics such as packet loss and bandwidth.
Network Performance Testing
While not very common, performance testing can also help measure network throughput. In this case, the network is subjected to different loads and conditions, and the throughput is measured under varying circumstances.
Skip to “Best Tools for Monitoring Bandwidth and Throughput”
Bandwidth vs. Throughput
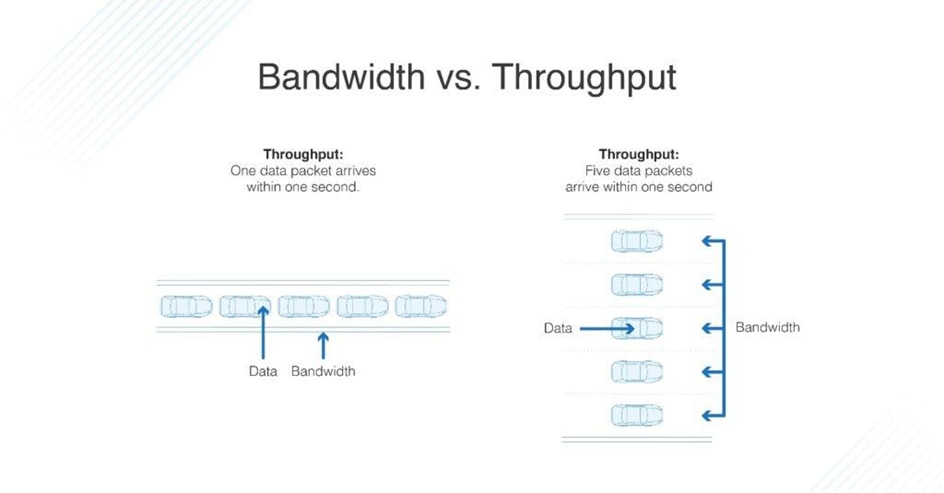
The difference between bandwidth and throughput isn’t necessarily simple. They tell you two different things about the data in your network, but they’re closely related. You can think of bandwidth as a tube and data throughput as sand. If you have a large tube, you can pour more sand through it at a faster rate. Conversely, if you try to put a lot of sand through a small tube, it will go very slowly. In short, throughput and bandwidth are two different processes with two different goals, both contributing to the speed of a network.
Data throughput meaning is a practical measure of actual packet delivery, while bandwidth is a theoretical measure of packet delivery. Throughput is often a more important indicator of network performance than bandwidth because it will tell you if your network is literally slow or just hypothetically slow.
5 Best Tools for Monitoring Bandwidth and Throughput
I’ve identified a few key products capable of performing somewhat different functions around monitoring and managing bandwidth and throughput on your networks. Check out this list of top tools to better understand which ones might be most helpful for your admin efforts.
1. SolarWinds Observability Self-Hosted (Free Trial)

© 2024 SolarWinds Worldwide, LLC. All rights reserved.
SolarWinds Observability Self-Hosted is a full-stack, comprehensive observability and management solution that provides a holistic view of your IT infrastructure, including databases, applications, servers, and networks. With built-in intelligence, it’s designed to help customers reduce remediation time and ensure availability across both multi-cloud and on-premises environments by increasing productivity, visibility, and intelligence.
SolarWinds Observability Self-Hosted serves as a unified solution that simplifies cloud migration efforts and helps optimize resource costs both on-premises and in the cloud. Plus, with API-sourced, agentless, and agent-based cloud infrastructure metrics, you get visibility across your hybrid environment. You can also get insight into your network devices with SolarWinds Observability Self-Hosted to ensure service availability, automate ASA firewall infrastructure monitoring, and more. By helping you detect anomalies across cross-domain datasets, the tool can help you increase productivity and efficiency.
Key Features
- Intelligent Maps, AppStack™, NetPath™, and PerfStack™ (performance analysis dashboards)
- AIOps for outlier detection
- Built-in and highly customizable cross-domain dashboards, reporting, analytics, and alerting
- Observability across database, applications, infrastructure, network, and cloud
- Full-stack solution for end-to-end operations visibility
Learn More Download Free Trial
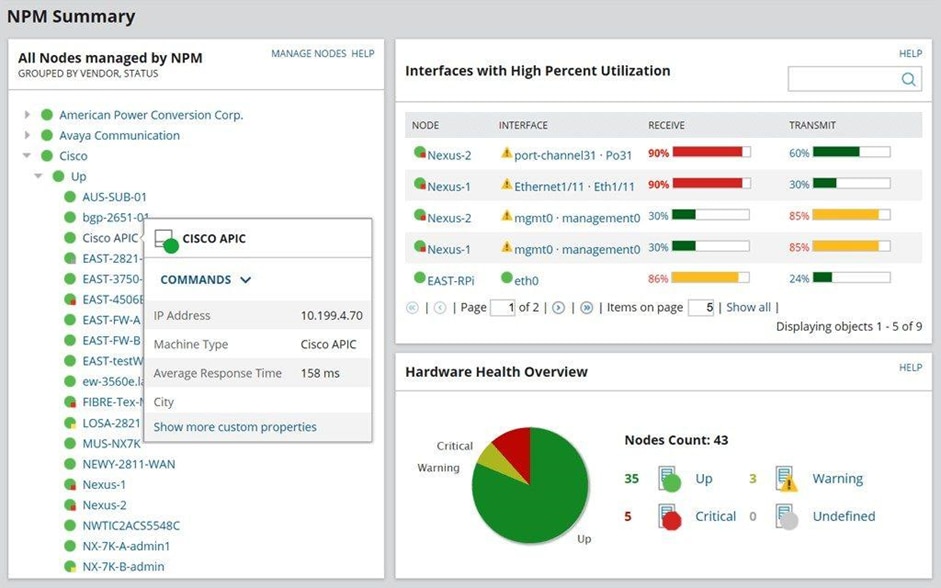
2. Network Performance Monitor (Free Trial)
Network Performance Monitor (NPM) from SolarWinds is a tried-and-true, multi-vendor network monitoring system specially designed for scalability. NPM offers a wide range of tools for monitoring and analyzing network performance, advanced alerting, reporting, and problem diagnosis.
© 2024 SolarWinds Worldwide, LLC. All rights reserved.
NPM’s LUCID (logical, useable, customizable, interactive, drill-down) user interface works like a dream. When you open it, you get a complete summary of all network activity, device status, and alerts, so you can see how your system is doing at a glance. It’s fully customizable too, so you can switch web resources, maps, and views around.
When you turn it on, you only see what you want, when you want it. This software is also excellent for troubleshooting. Is it the app or network that’s slow? What’s up with this constant flood of alerts? How do I keep up with a constantly changing network? NPM makes answering these questions easy. The NetPath, PerfStack, and Intelligent Map features are huge helpers here. Technical note: It requires Windows Server 2016 or later.
Key Features
- Easy troubleshooting with PerfStack and NetPath
- Intelligent network alerting to ensure your team only gets meaningful information
- Auto-generated network visualization maps provide a unified view of your network
- Helps to continuously monitor the availability and performance of network devices
Learn More About the Product Download Free Trial
3.Manage Engine NetFlow Analyzer
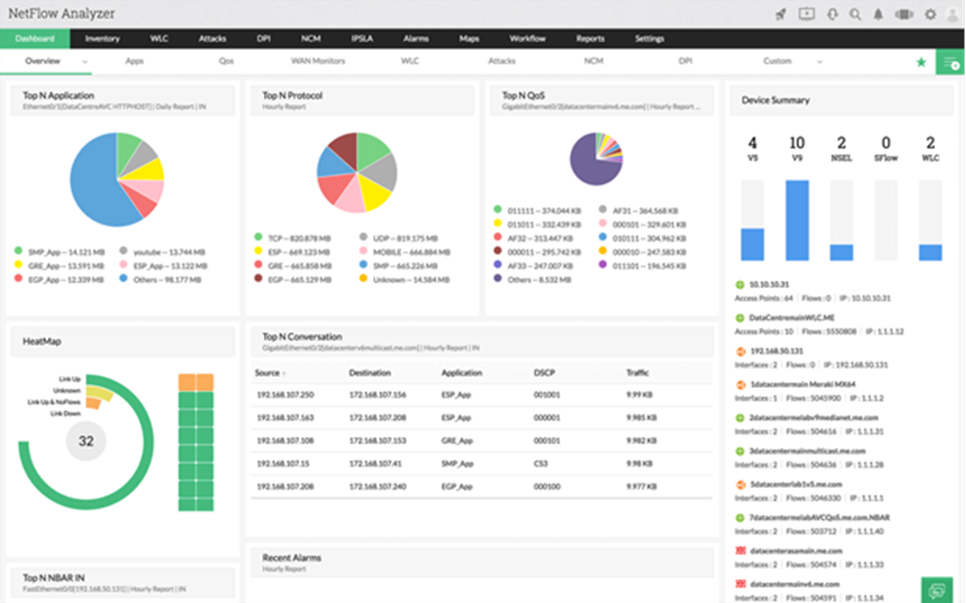
© 2024 Zoho Corporation Pvt. Ltd. All rights reserved.
Manage Engine NetFlow Analyzer is a bandwidth monitoring and traffic analytics tool that provides real-time visibility and a holistic view of your network’s traffic patterns and network bandwidth. It also collects and analyzes where and by whom your network bandwidth is being used and is a great tool for network flow monitoring, network forensics, and network traffic analysis. In addition to the network traffic, NetFlow Analyzer also provides complete visibility into the access points, SSIDs, WAN links, application performance, IPs, devices, wireless networks, and interfaces. Plus, the Continuous Stream Mining Engine technology helps detect many internal and external security threats and identify zero-day intrusions. The tool also supports a variety of Cisco technologies, including CBQoS.
Key Features
- Allows monitoring of traffic patterns and network bandwidth at interface-specific levels
- Provides real-time insight into your bandwidth
- Helps identify zero-day intrusions and context-sensitive anomalies
- Classifies non-standard applications that take up your network bandwidth
- Helps analyze flows from devices like HP, Cisco, Juniper, and 3COM
4. Paessler PRTG Network Monitor
Another helpful throughput and bandwidth monitoring tool is the Paessler PRTG Network Monitor. It’s got a good blend of visibility, scalability, and ease of use. PRTG is a powerhouse of a tool, combining auto-discovery, network monitoring, NetFlow analysis, cloud monitoring, VMware monitoring, and database monitoring in one system.
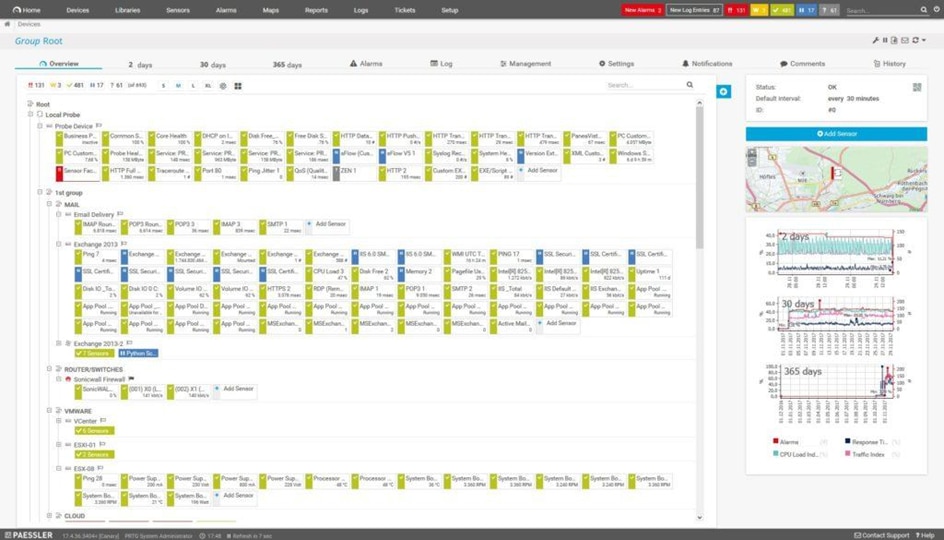
©2024 Paessler AG.
Of special note here is the auto-discovery feature. With auto-discovery, PRTG Network Monitor scans your network’s segments by pinging specific IP ranges. This way PRTG will automatically recognize all of your connected devices and systems in the future and create custom sensors for them. This saves a lot of time when it comes to configuration, so another plus for this system is its quick and easy setup. In terms of packet loss, this software has a number of functions to help you rein it in.
Packet Sniffer sensor, Cisco IP SLA sensor, and QoS One Way sensor all let you see how well packets are traveling within your network. For example, the Packet Sniffer sensor allows you to view past and present data in terms of dials and pie charts. In addition, a comprehensive alert system lets you know when warnings or unusual metrics have been detected in your network.
Key Features
- No vendor lock-in; allows you to monitor everything in your IT infrastructure
- Custom dashboards and maps provide an overview of your infrastructure
- Automatic network discovery makes it easy to set up monitoring
- Real-time alerts via the channel you prefer
5. Remote Monitoring & Management (RMM)
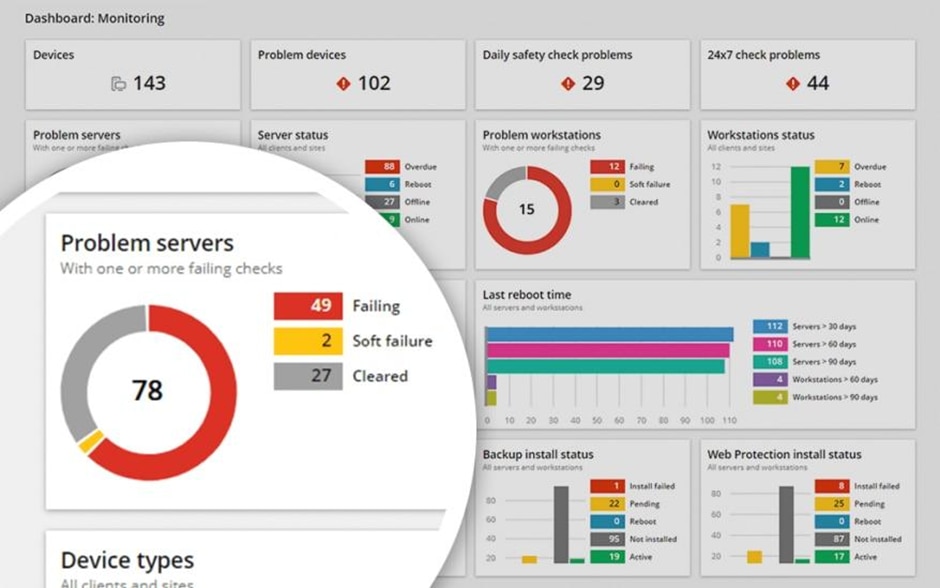
© 2024 N-able Solutions ULC and N-able Technologies Ltd. All rights reserved.
If you’re a managed service provider, you don’t just need to worry about bandwidth monitoring for a single website or network. You’re responsible for monitoring the performance of hundreds of client networks and responding quickly to resolve problems when they arise. That means you need a different kind of solution than the options mentioned above.
That’s why we’ve waited until now to mention Remote Monitoring & Management (RMM). This all-in-one solution is designed to meet the unique needs of managed service businesses. It provides a full suite of features—including robust web protection and monitoring and defense against diverse threats such as malware, phishing, adware, botnets, and spam—as well as customizable access controls and more.
Key Features
- Complete remote management solution with monitoring, patch management, and alerting
- Flexible automation with 400 pre-configured scripts
- Makes it easy to manage devices, users, and endpoints across cloud, hybrid, and physical environments
Additional Tool: NetFlow Traffic Analyzer (Free Trial)
The SolarWinds NetFlow Traffic Analyzer (NTA) is a robust addition to the Network Performance Monitor that makes it easy to view the bandwidth used by IP addresses, applications, and protocols. It helps identify network bandwidth hogs and analyzes usage, allowing you to determine whether you need to add capacity or block top users to prevent slowdowns and outages.
Another great thing about NTA is the summary screen that provides a comprehensive overview of the flow traffic. You can take a look at the NetFlow sources, bandwidth usage, application activity, and other tabs to know where the bottleneck actually lies. Plus, you can set up application alerts to notify you whenever there’s unusual activity.
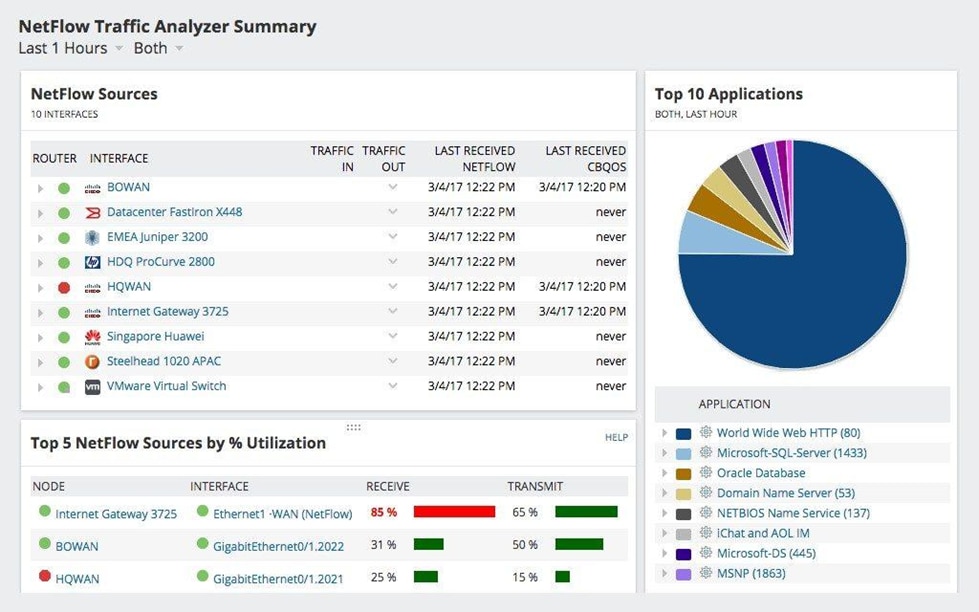
© 2024 SolarWinds Worldwide, LLC. All rights reserved.
NTA also provides greater visibility into network performance, bandwidth usage, and wireless traffic trends. And by automatically turning utilization data into tables and charts, you get a better contextual understanding of your network traffic. The tool also helps identify network congestion issues and displays endpoints that consume the most.
Key Features
- Network congestion solution helps resolve network issues quickly
- Data correlation provides greater visibility into the network’s traffic
- Port 0 monitoring helps provide visibility into malformed or malicious traffic
- Allows tracking application traffic that comes from designated source and destination IPs
Learn More About the Product Download Free Trial
Throughput and Bandwidth Explained—Final Thoughts
Monitoring network throughput is essential for understanding your network performance. It helps optimize performance, troubleshoot issues, and ensure resource allocation meets demand. At the same time, it also helps identify bottlenecks and detect security threats. SolarWinds SolarWinds Observability Self-Hosted is a comprehensive solution that offers deep visibility into your IT infrastructure, and the built-in intelligence ensures availability and helps cut down on remediation time. It provides end-to-end visibility into on-premises and cloud environments and makes capacity management easy.
Recommended Reading
If you want to learn more about network monitoring and get an in-depth breakdown of best practices, check out this Ultimate Guide to Network Monitoring.