
Digital infrastructure hinges on the robustness of network performance. Whether it’s for streaming high-definition videos, engaging in competitive online gaming, or ensuring that critical business applications run without a hitch, the stability and speed of a network can make or break the digital experience. Central to this stability are three key performance indicators: jitter, packet loss, and latency. This post unpacks these terms, deeply diving into their meaning and why they matter. We’ll also look at the five best tools you can use to improve network performance.
How to Improve Network Performance
5 Best Tools for Improving Network Performance
1. SolarWinds Observability SaaS (30 Days Free Trial)
2. SolarWinds Observability Self-Hosted (30 Days Free Trial)
Understanding Data Packets
Data packets are a collection of small units of digital information that enable the transmission of data across computer networks. These packets are structured into three parts: header, payload, and trailer. The header contains information on the packet type, the length, and specific source and destination IP addresses. The header ensures the packets find their way through the complex web of the internet to reach their intended destination. The payload has the data being transmitted, for example, text, audio, or video streams. The trailer contains error-checking information that ensures the data packets are not corrupted during transmission.
Data packets facilitate the efficient exchange of information, allowing smooth online communication like browsing, streaming, and file sharing. Packets allow multiple data streams to travel simultaneously across a network, thus contributing to the overall reliability and speed of digital communication.
Network Performance Metrics
Network performance metrics are measurements we can use to assess a computer network’s efficiency, reliability, and overall health. The metrics provide insights into how well the network functions and help identify improvement areas. The key network performance metrics include jitter, packet loss, and latency.
1. Jitter
Jitter in networking refers to the variation in the delay of received data packets over a network. It manifests as irregularities in the timing of packet delivery. Jitter occurs because of fluctuations in network congestion, routing inefficiencies, or varying transmission distances. When packets encounter differing delays along their route, it leads to irregular arrival times at the destination. Consistent packet delivery is crucial in real-time communication applications like video conferencing or voice calls. Jitter disrupts this consistency, causing disruptions, delays, or poor audio/video quality.
The acceptable jitter level depends on the type of communication and the applications being used. For real-time communication like voice or video calls, a lower jitter of 30 milliseconds (ms) or less is acceptable.
Some ways to mitigate jitters include quality of service (QoS), traffic shaping, and using jitter buffers. Implementing quality of service involves prioritization of critical data. Traffic shaping controls the flow of data, preventing network congestion. Using jitter buffers temporarily stores and organizes incoming packets before their playback adjusts the variations in arrival times. By introducing a controlled delay, jitter buffers can smooth out the discrepancies in packet arrival. As a result, it ensures consistent and seamless delivery of audio or video data.
2. Packet Loss
Packet loss is where data packets traveling across a network cannot reach their intended destination. It can happen because of various factors like network congestion, hardware issues, or transmission errors. Packet loss leads to gaps in data transmission, causing disruptions or degradation in the quality of audio, video, or other transmitted content.
You can use ping and traceroute to test for packet loss. Ping sends a series of ICMP (Internet Control Message Protocol) echo request packets to a destination host and waits for echo reply packets. If the destination host doesn’t return echo request packets, then there’s a packet loss. Traceroute traces the path of UDP packets to a destination host. It assigns each packet a unique time-to-live (TTL) value. As packets move, routers decrease the TTL. Upon reaching zero, the router discards the packet and sends an ICMP time-exceeded message to the source host. Traceroute uses these messages to map the route of packets. In cases of packet loss, it identifies the specific router where the loss occurred.
3. Latency
Latency is the time delay in data communication between the source and destination over a network and is measured in milliseconds. Various factors influence the latency, like the distance between servers, the quality of network equipment, and the processing speed of devices.
The metrics for measuring latency include round-trip time (RTT) and one-way latency. RTT represents the total time for data to travel from the source to the destination and back. One-way latency focuses on the time for data to reach the destination.
Reducing latency involves implementing strategies to minimize the time delay in data transmission, like using content delivery networks (CDNs) to store data closer to end users.
How to Improve Network Performance
Some ways you can improve network performance include:
- Implement quality of service (QoS) policies to prioritize network traffic, preventing congestion and ensuring a smoother data flow.
- Invest in high-performance routers, switches, and network infrastructure to handle increased data loads and provide better throughput.
- Leverage CDNs to distribute content across multiple servers strategically, reducing latency and improving the speed of content delivery.
- Distribute network traffic evenly across multiple servers to prevent overload on specific devices, ensuring optimal resource utilization.
- Use network monitoring tools to continuously assess performance metrics, allowing for proactive identification and resolution of potential issues.
5 Best Tools for Improving Network Performance
1. SolarWinds Observability SaaS (30 Days Free Trial)
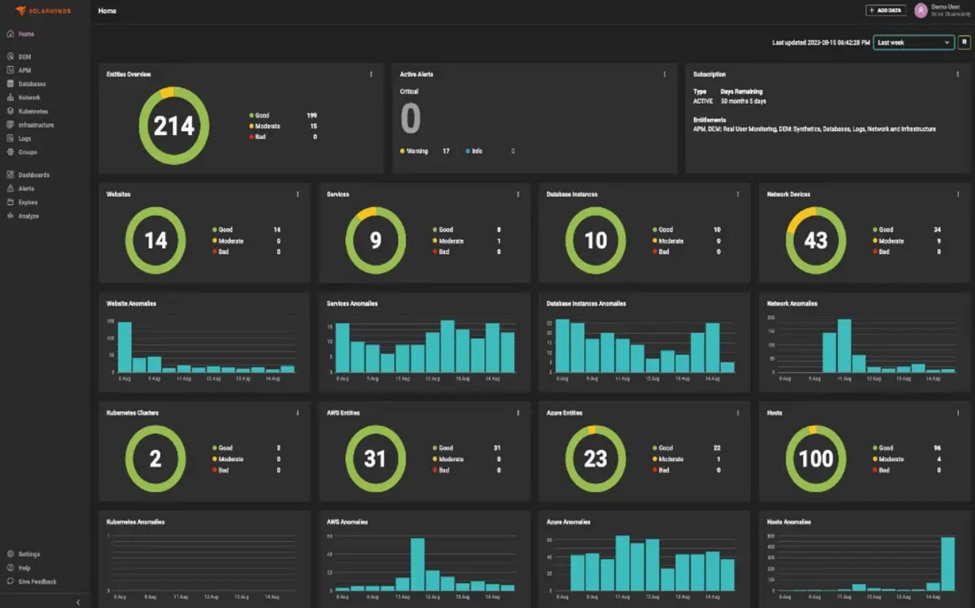
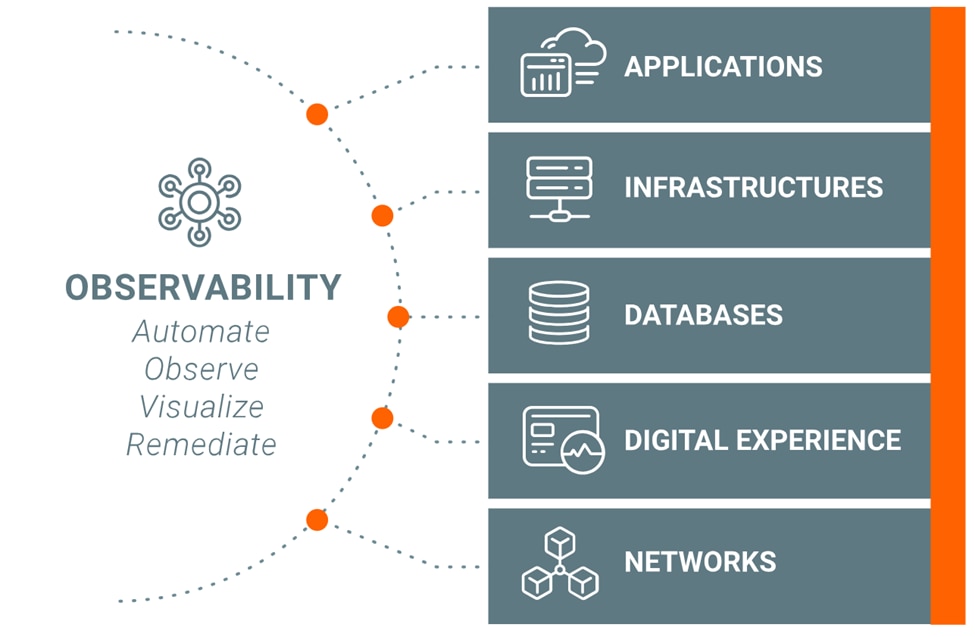
SolarWinds Observability SaaS is a SaaS solution that offers a single platform that brings together comprehensive insights into applications, infrastructure, and logs, which is important for maintaining a high-performance network. It eases the stress and complexity of managing a modern, sprawling network infrastructure.
©2024 SolarWinds Worldwide, LLC. All rights reserved.
Here’s how it improves network performance:
- Comprehensive visibility: It integrates data from various IT environments to give a complete picture, which is vital for understanding and optimizing network performance.
- Full-stack observability: This feature ensures that the performance of every aspect of the network is monitored, from the underlying infrastructure to the applications running on it.
- AI-enhanced operations: Machine learning helps predict and identify potential network issues before they become critical, thus maintaining smooth network operations.
2. SolarWinds Observability Self-Hosted (30 Days Free Trial)
SolarWinds Observability Self-Hosted is an observability solution designed for organizations of various sizes and sectors. The platform is easily deployable and scalable, with a single installation process and flexible licensing options, accommodating environments ranging from smaller setups to enterprise-scale.
©2024 SolarWinds Worldwide, LLC. All rights reserved.
How it improves network performance:
- It provides end-to-end visibility across on-premises and multi-cloud environments, which is essential for detecting and addressing network performance issues promptly.
- It offers observability across various IT components, from network and cloud infrastructure to applications and databases, enabling a thorough understanding of component-to-service dependencies and potential issues.
- The platform includes features for proactive quality of experience monitoring, log management, and anomaly detection, which help identify and resolve issues before they impact network performance.
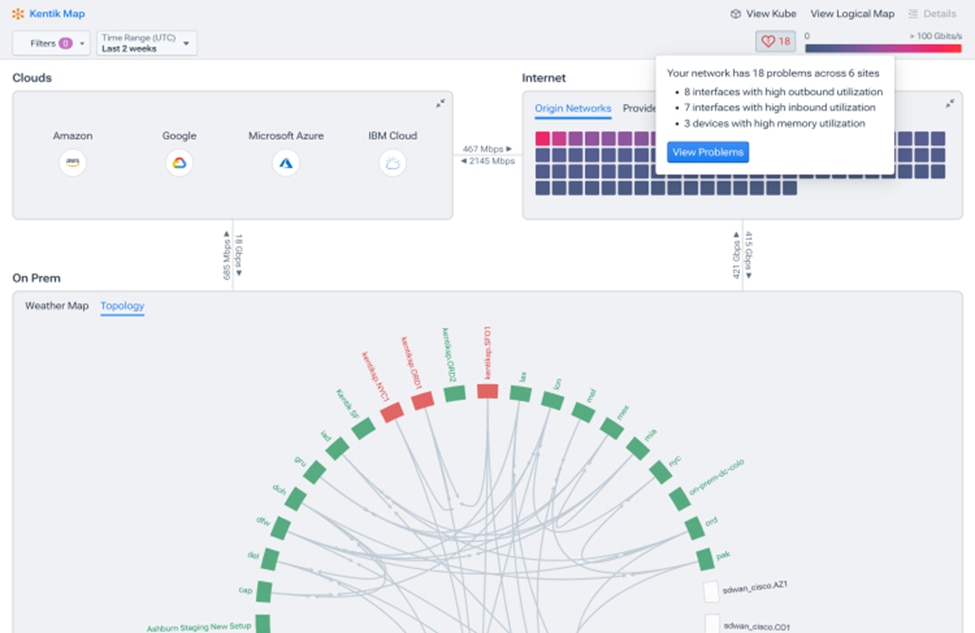
3. Kentik
Kentik’s End-to-End Network Performance Monitoring (NPM) is tailored for comprehensive monitoring across complex, multi-vendor, and multifaceted network architectures, including hybrid and distributed networks.
Copyright © 2024 Kentik. All rights reserved.
Let’s look at how it enhances network performance:
- Unified telemetry platform: It consolidates network telemetry data into one platform, providing a holistic view across diverse network environments.
- Intelligent automation and alerting: It uses intelligent automation that offers meaningful insights and minimizes alert fatigue.
- Multi-cloud performance tracking: It monitors traffic performance across hybrid and multi-cloud environments, enabling IT teams to keep a close eye on their distributed networks and ensure that performance levels meet business needs
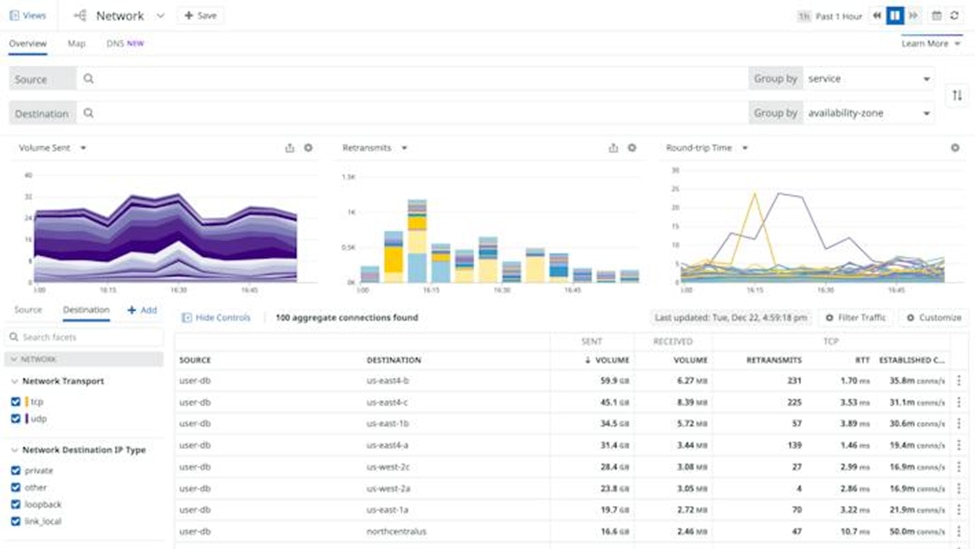
4. Datadog
Datadog’s Network Performance Monitoring (NPM) tool gives IT teams comprehensive visibility into their network performance, encompassing both on-premises and cloud networks. This tool helps identify, diagnose, and resolve network-related issues, ensuring smooth operation and performance.
© Datadog 2024
How does it improve network performance?
- Performance optimization: Continuous monitoring of key metrics allows for optimizing network operations and improving application performance.
- Cost management: Insight into traffic patterns and spikes helps manage and optimize costs associated with cloud networking.
- Proactive monitoring: The ability to monitor health and performance preemptively aids in preventing issues before they affect the network or end-user experience.
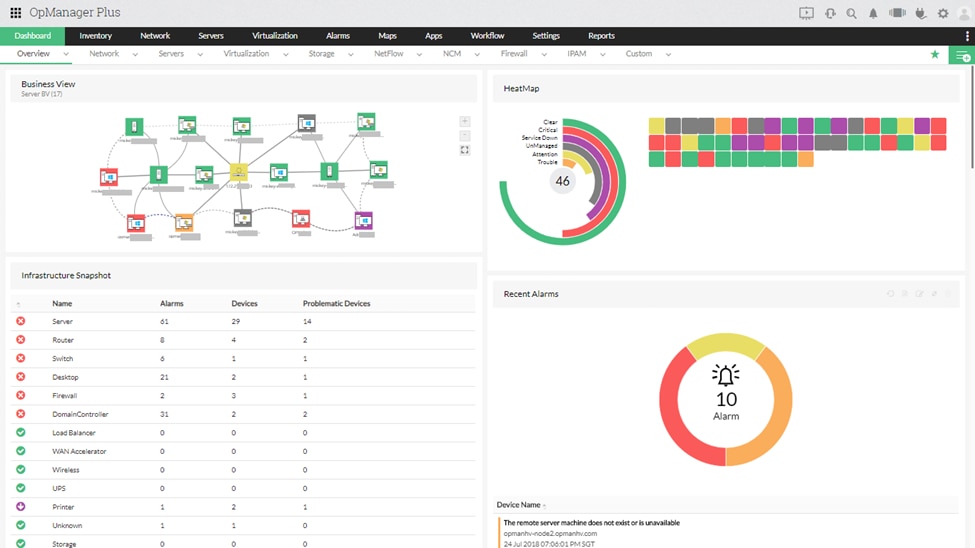
5. ManageEngine
ManageEngine OpManager Plus is a comprehensive IT operations management software that enhances the management of networks, servers, IP addresses, and switch ports.
© 2024 Zoho Corporation Pvt. Ltd. All rights reserved.
Here’s an overview of how it can improve network performance:
- Firewall management integration: It has functionalities for analyzing firewall rules, logs, and policies. Managing and optimizing these firewall aspects can enhance network security and performance.
- Network and server performance monitoring: Its server monitoring capabilities extend to VoIP devices and WAN networks, helping to identify potential issues in the IT infrastructure environment.
- Bandwidth and traffic management: It provides in-depth visibility into device and interface traffic, enabling proactive bandwidth capacity planning and network behavior analysis for anomaly detection.
Summary
To optimize network performance, strategies include minimizing jitter through the use of jitter buffers, addressing packet loss through testing and mitigation techniques, and reducing latency through various methods like optimizing protocols, upgrading hardware, and using comprehensive network monitoring tools. While each tool has unique strengths, SolarWinds Observability SaaS emerges as the leader for a thorough analysis targeting jitter, packet loss, and latency. Request a demo or start a free trial today and experience the power of unified observability firsthand.
This post was written by Mercy Kibet. Mercy is a full-stack developer with a knack for learning and writing about new and intriguing tech stacks.