
When it comes to improving websites, choosing where to focus your resources can be challenging. Ideally, you’ll have the best possible data points to guide your decisions. Of course, this means you’ll need to know how to collect them.
Leveraging the power of a website monitoring tool can be beneficial. As far as applications go, you have several options. However, comparing feature sets and user interfaces can be time-consuming; this guide is here to do some of the heavy lifting for you.
In this article, we’ll give you an overview and comparison of the features for SolarWinds® Pingdom® and GTmetrix. Then you can review advice on how to get started with website monitoring using your chosen tool.
Pingdom and GTmetrix: A Feature Comparison
From the outside, Pingdom and GTmetrix appear to offer similar services. To conduct a meaningful review, we’re going to focus on each solution’s monitoring locations, speed testing techniques, rating scales, and pricing.
Pingdom
Pingdom is part of the SolarWinds application performance monitoring (APM) family of products. Their goal is to provide tools for website performance monitoring. Ultimately, they want to make the web faster and more efficient for everyone.
Pingdom has a long history of providing helpful IT services, such as free page speed testing. Let’s take a closer look at how it works.
Speed Rating Scale
We’ll start by explaining how Pingdom rates page loading speeds. It uses a rating system developed by YSlow, and its grading matrix is based on 23 testable rules. When you perform a speed test with Pingdom, you’ll receive an overall score out of 100.
YSlow then uses letter grades of A through F (including E) to represent your site’s performance. Any score from zero to 50 points is an F. Afterward, letters are assigned for every increment of ten points.
Speed Testing Techniques
Another element to consider when comparing performance monitoring tools is how the application tests page speed. There are several different ways to approach this, and you need to know how the page loading process works to understand why it’s important.
When a webpage loads, it goes through several phases. These phases span from the time a user makes a request through the browser to the time to first byte (TTFB) and page load completion.
Pingdom offers the following insights when testing your pages:
- Your webpage’s TTFB
- How long it takes for the main HTML document to load (minus any style sheets or images)
- How long it takes for all the page resources to load, including scripts, style sheets, and images (minus any lazy load items)
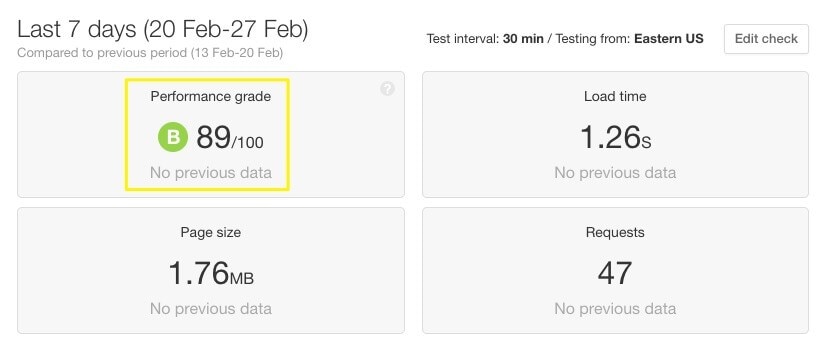
All metrics can be found in the page speed reports Pingdom offers.
Test Locations
Pingdom leverages more than 70 global locations for performance testing. This means you can choose from five different regions in your dashboard when you set up your uptime checks.
Afterward, Pingdom automatically delegates the work to 10 probe locations. These are selected to be as varied as possible so your data can provide meaningful insights. The default region is set to include Europe and North America.
Pricing
As of June 2020, there are two scalable pricing tiers and an Enterprise option.
If you’re interested in the Enterprise services, you’ll have to call a sales rep to determine your pricing. Additionally, you can get a 14-day free trial of Pingdom if you’d simply like to try it out.
GTmetrix
GTmetrix was developed by parent company GT.net in 2009. It began as a service offered to the company’s web hosting clients, and it grew from there. Now, GTmetrix offers features to help users of all skill levels monitor and remedy their website performance problems.
GTmetrix boasts over 350,000 registered users, and it’s analyzed more than 350 million web pages. It’s a well-known name in the business of improving web performance.
Speed Rating Scale
Like Pingdom, GTmetrix uses YSlow scoring. It also provides a Google PageSpeed score as a part of its performance report.
Like the reports in Pingdom, GTmetrix then assigns the scores a letter grade. Users also receive a few other basic metrics, which we’ll cover in more detail in the next section.
Speed Testing Techniques
GTmetrix provides data based on a page’s “fully loaded” time. Unlike Pingdom, the test stops timing two seconds after all network activity has stopped.
In addition to page loading speed scores, GTmetrix reports include the following:
- The size of the page loaded
- The number of requests made
- The location of the test server
- The web browser used during the test
Additionally, GTmetrix offers some granular testing options, including the selection of different browsers. The test will then run in a simulated environment meant to represent the chosen configuration.
Test Locations
With seven locations, including China, India, and Canada, GTmetrix offers 32 servers for use during testing. If you’re a registered user, you can select the location you’d like to use. This enables users to simulate what their website visitors are experiencing.
If you’re interested in learning more about the servers in all the available locations, you can visit GTmetrix’s server status page.
Pricing
Much like Pingdom, GTmetrix offers several pricing tiers. It starts with a free basic plan and goes up from there.
Each tier adds more capacity, including access to priority testing. At certain price levels, your tests take priority over those in lesser service tiers.
Why Pingdom Is Your Best Choice for Performance Monitoring
In our opinion, Pingdom has some clear advantages over GTmetrix. One of the main advantages Pingdom has is its detailed communication options. This includes customizable alerts to help ensure certain team members are alerted when triggers are met.
Pingdom also offers a user-friendly interface, comprehensive performance testing and monitoring, and highly accessible and detailed report options. Additionally, if you plan on integrating Pingdom with other sites or services, it’s easy to generate API tokens for development projects.
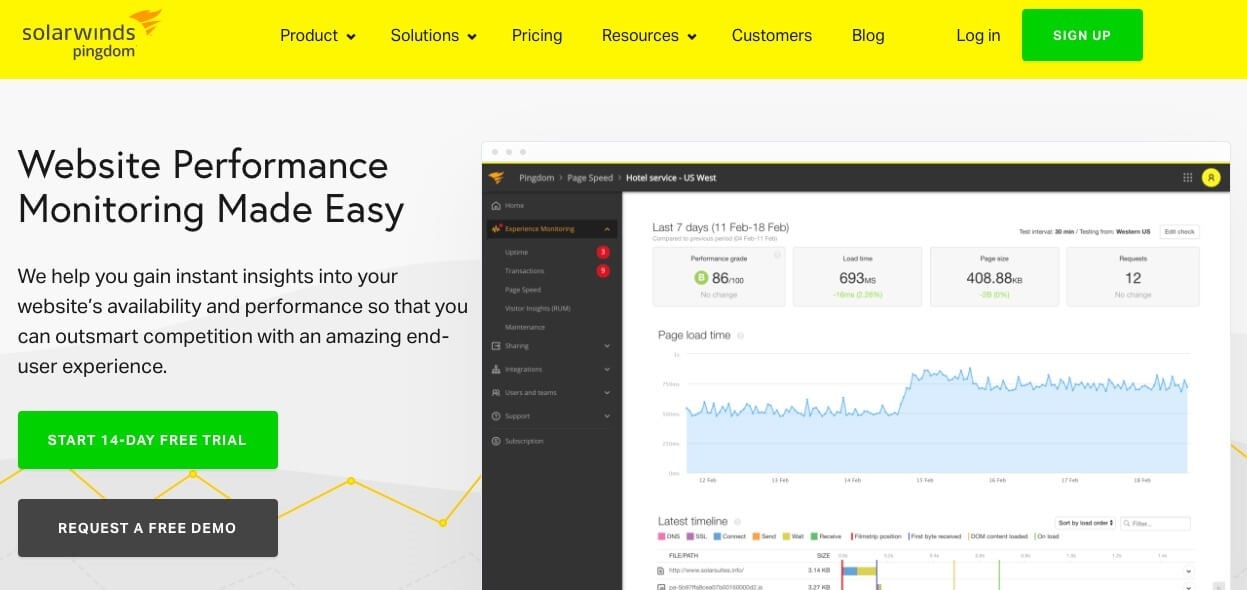
How to Get Started With Pingdom
Getting started with Pingdom is simple. You can begin a trial of the product by visiting their home page and selecting Start 14-Day Free Trial. No credit card is required.
Next, you’ll provide some basic account information.
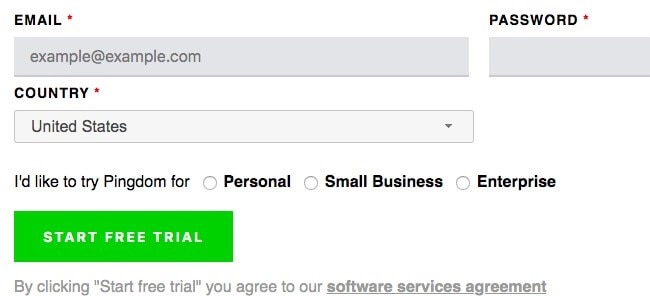
Then you can start using the monitoring features. It’s simple and easy!
Conclusion
Understanding how your website is performing is vital to keeping your users happy and your business running smoothly. This is why Pingdom offers flexibility and user-friendly dashboards and reports.
Overall, Pingdom makes it easy for anyone to monitor their website performance. Users receive data helpful for developing strategy and allocating resources. Plus, the flexible pricing options mean it’s a solid fit for nearly any budget.