
VMware products are well known and fairly easy to explain. The VMware ESXi server, however, is one of the more complicated and lesser-known VMware products. To help you understand the VMware ESXi server, how to monitor ESXi, and VMware ESXi management, this guide will answer the following:
- What is a VMware ESXi server?
- What is a VMware ESXi cluster?
- How to monitor a VMware ESXi server
- How to connect to a VMware ESXi server
- How to achieve successful VMware ESXi management
This guide will also outline the key features of SolarWinds® Virtualization Manager (VMAN), a robust and dependable tool for VMware ESXi management.
What Is VMware ESXi Server?
VMware ESXi server is a bare-metal, purpose-built hypervisor offering a wide range of enterprise-grade features. VMware ESXi is placed directly onto a physical server, allowing it to be separated into several virtual machines, which significantly reduces the need for hardware purchases and upgrades. With direct access to and control over underlying resources, the VMware ESXi server effectively partitions hardware, consolidating applications and cutting costs.
IT teams are under a lot of pressure to meet changing market trends and increasing customer expectations. They’re also faced with the challenge of stretching their IT resources to accommodate more complex projects. VMware ESXi can help IT teams balance the need for both IT savings and improved business outcomes by enabling you to:
- Reduce the number of hardware resources required to run the hypervisor
- Increase performance
- Consolidate hardware for higher capacity utilization
- Streamline IT administration through centralized management
What Is a VMware ESXi Cluster?
A key feature of the VMware ESXi server and virtual infrastructure is the ability to configure cluster pools and resource pools. A cluster is a group of tightly coupled computers working in close collaboration, allowing them to act in many respects as a single computer. A VMware ESXi cluster functions in the same way. Clusters are typically used to facilitate high availability, high-performance computing, and effective load balancing.
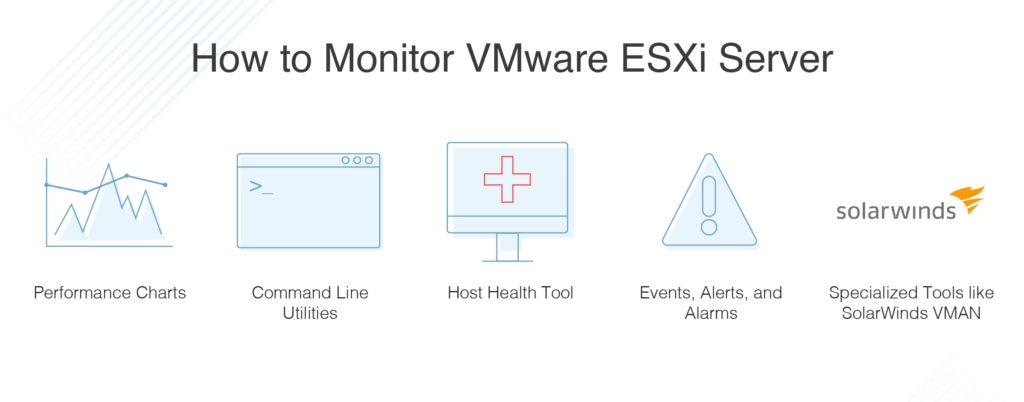
How to Monitor VMware ESXi Server
Understanding how to monitor VMware ESXi server and how to monitor ESXi host is important for monitoring the health and performance of physical hardware backings for the virtual environment and virtual devices in the virtual environment. Monitoring the server effectively can also help you troubleshoot system problems, configure alarms, and configure SNMP messages.
VMware gives administrators access to several tools to help you monitor your virtual environment and identify the source of potential problems.
Performance Charts
These allow you to view performance data on a range of system resources, including memory, storage, CPU, and more.
Command Line Utilities
These give you access to detailed information on system performance via the command line.
Host Health Tool
This allows you to rapidly identify which hosts are healthy and which might be experiencing problems. If you’re wondering how to monitor ESXi host health, the Host Health VMware tool is instrumental.
Events, Alerts, and Alarms
These tools allow you to configure alerts and alarms. You can also specify actions the system should take when certain alarms or alerts are triggered, automating repetitive tasks and saving you time.
System Log Files
These files contain extra information regarding activities in your virtual environment.
Here are some key VMware items you should monitor:
- CPU usage
- Memory usage
- Memory available
- Memory used
- Network packets received
- Network packets transmitted
- Network receiving rate
- Disk usage
- Disk space available
- Disk space used
How to Connect to VMware ESXi Server
If you’re asking yourself how to connect to VMware ESXi server, the simplest way is through the vSphere Client and the vSphere Web Client. These allow you to manage your ESXi host and operate its virtual machines. You can use the vSphere Client to connect directly to the ESXi host. If you use vCenter Server, you can use the vSphere Client to connect to and control the vCenter Server. Administrators can also use the vSphere Web Client to connect to and operate vCenter Server via a web browser.
To successfully connect to the VMware ESXi server using vSphere client, you first need to connect your computer directly to the device and temporarily alter the computer’s IP settings. The device will lose internet and network connections as a result. Once the task is complete, you can restore the connections as necessary.
VMware ESXi Management
For management functionality, ESXi relies on remote utilities instead of a service console. There are two methods for configuring an ESXi host. The first is using the VI client for graphical configuration, and the second is using the remote command-line interfaces (RCLI) for command line-based and scripted configuration.
These methods provide near-equivalent functionality for most configuration activities. You may choose one or the other depending on your experience and preference. If you’re new to ESXi, or you require a simpler graphical interface, you should use the VI client. If you’re more experienced and would prefer the flexibility and speed associated with command-line tools and scripting, the RCLIs is probably more suitable.
You can connect the VI client to the VirtualCenter or directly to an ESXi host. You can also use a terminal or command prompt session on a remote device to send commands either to an ESXi host or to VirtualCenter Server. This would execute the command on the specified ESXi host under its management by using a private protocol. If you plan on using the VI client or RCLI through VirtualCenter, you must be known to VirtualCenter and have the appropriate privileges.
When connecting directly to an ESXi system, your credentials should be mapped to a local user on the system. This user must also have the appropriate privileges locally defined on the system to run each command. The privilege model used by ESXi is a subset of the privilege model used by VirtualCenter. To allow individual tasks, like managing virtual machines, you can define custom roles on ESXi. Tasks that apply only to multiple ESXi hosts in the VirtualCenter context, like cluster administration, don’t apply to ESXi. Either way, you can define custom roles to aggregate privileges according to your individual needs.
The set of roles and users defined on VirtualCenter is entirely independent of any scheme defined on the ESXi hosts, which are independent of each other. Any synchronization between individual entities must be performed manually. As such, it’s more efficient to use VirtualCenter, because it centralizes user management. You could, however, still use local user accounts on the ESXi host, especially if the VirtualCenter is unavailable or if you want to manage a small environment with a minimal number of hosts.
SolarWinds Virtualization Manager (VMAN)
Effective monitoring and management of VMware ESXi, or any other virtualization environment, is a continuous and time-consuming process. Although VMware offers a range of built-in utilities to assist with VMware ESXi management, the user experience isn’t especially intuitive or streamlined. If you’re looking for a VMware performance monitoring and event log monitoring solution with a centralized and user-friendly approach to VMware management, SolarWinds VMAN comes highly recommended.
SolarWinds VMAN allows you to monitor VMware performance with easy-to-navigate, customizable dashboards, giving insight into the overall health of your environment. The environment view automatically maps virtual machines to their dependent host, related objects, and datastores, giving you visibility into how virtual machines and hardware performance are related. VMAN lets you drill deeper into hosts, virtual machines, and other datastores to view performance metrics and alerts in greater depth. The host hardware health function alerts you to any pending component failures for your ESX hosts.
This solution uses recommendations to optimize your VMware resources, analyzing your virtual environment and highlighting VMs using many resources while sitting idle. VMAN also identifies VMs in need of access to more resources. This tool includes CPU and memory right-sizing recommendations, which are presented with VMware management actions, allowing you to implement an immediate resolution of any issue. These features help you achieve optimal virtual machine performance. VMAN conducts storage analyses, identifying VMs with large snapshots and orphaned VMDK files, allowing for immediate storage relief and the reallocation of resources when necessary.
With VMAN, you have access to detailed alerts to help you streamline VM performance monitoring. VMware uses thousands of metrics and counters to analyze VMware performance, which can make knowing which ones to focus on a challenge. VMAN is preconfigured with key VMware counters and thresholds turned on by default. These alerts are separated into potential alerts and active alerts, allowing you to troubleshoot proactively. Alert details provide trigger conditions, history, and remediation advice to help you resolve problems rapidly. These alerts are correlated to provide VMware-specific alerts, such as Co-Stop, Memory Ballooning, VM Swap, and many more.
Two of the most common bottlenecks within a VMware environment are network latency and misuse of storage I/O. In a large operating system environment handling multiple applications, appropriate resource allocation can be difficult. VMAN gives you a comprehensive view of shared storage and silos in a single pane of glass. Customizable dashboards give you visibility into critical storage metrics, including IOPs, throughput, and read/write, helping you address contentious application performance problems.
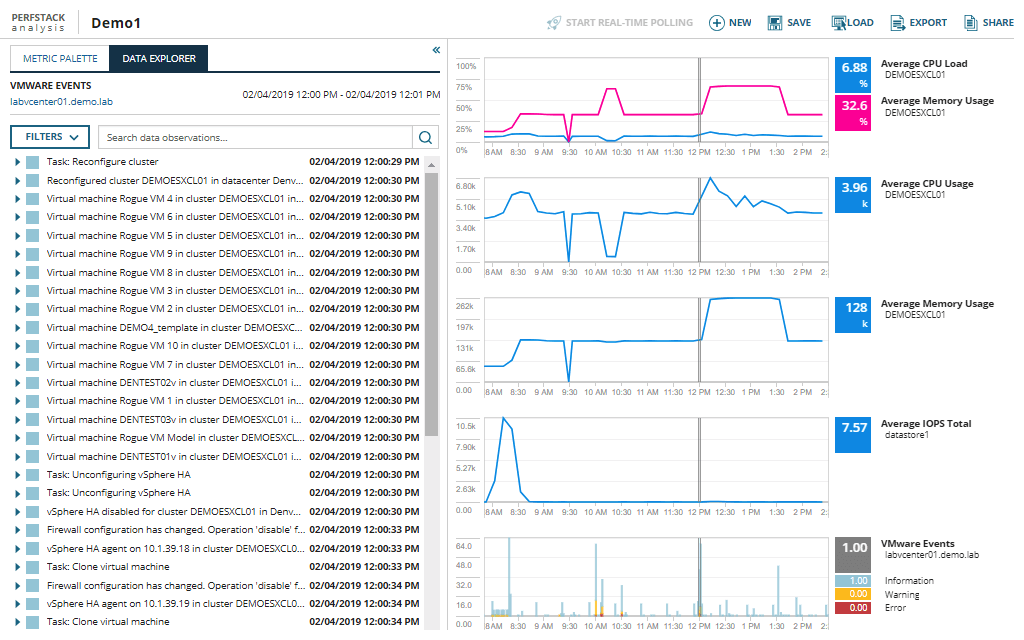
VMAN is a quick and efficient troubleshooting tool designed to rapidly highlight and send automated alerts when a resource is experiencing problems. When adding VMware events to your event database monitoring view, the analytic graphs and charts can give insight into the activities that might have led to the performance issues. This big picture view can help you find the root cause of a problem quickly.
Adopting VMware offers advantages over traditional server provisioning. For example, virtualization provides administrators with improved agility, allowing them to quickly and easily create virtual machines. However, this improved speed and increased simplicity can also create performance issues, which may disappear temporarily only to reappear later, in the form of more critical issues. With VMAN, you can go back into VMware events logs and see when virtual machines were initially spun up. This means you can analyze the immediate and historical impacts of individual VMs, with insight into the impact they may have had on the rest of your systems.
Getting Started With VMware ESXi Monitoring and Management
Hopefully, this guide has given you some insight into the complexity of monitoring and managing a VMware ESXi server. Although VMware makes some monitoring and management utilities available to its users, most users find they need to leverage specialized virtualization management tools.
SolarWinds VMAN is an enterprise-grade, scalable, and user-friendly tool designed to give you maximum insight into your environment. With customizable dashboards and advanced analytics, VMAN is a good option for IT professionals wanting to gain more control over their virtual environment. You can access a 30-day free trial of VMAN by clicking here.