
According to a Web Server Survey 2020 conducted by Netcraft, more than 400 million websites across the world trust NGINX to deliver their content quickly, reliably, and safely. To ensure the smooth functioning of the server and its applications, NGINX writes events in different log formats, including the error log and the access log. Handling massive volumes of these logs generated from multiple NGINX endpoints, servers, and applications becomes difficult. As logs help determine server performance issues, security issues, server usage stats, trends, and outages, it becomes crucial to monitor these logs consistently. This is where NGINX log analyzer tools greatly help.
Log monitoring and analysis tools help provide meaningful insights you can use to optimize business operations and make data-driven decisions. An NGINX log analyzer tool can easily monitor and analyze logs, identify issues long before they occur or as they happen, and avoid further delays without losing time.
Outlined below are five NGINX log analyzer tools organizations can leverage to drive business growth.
SolarWinds Loggly
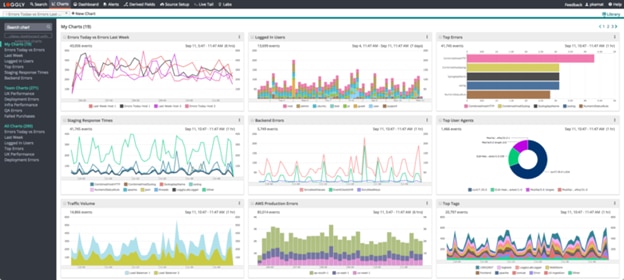
SolarWinds® Loggly® is a powerful cloud-based tool designed to simplify and speed up log aggregation, monitoring, and analysis. It centralizes logs gathered from a distributed environment to correlate data for better analysis. Loggly makes log analysis simpler and faster and requires minimal configuration to set up. It can collect logs from various sources without installing an agent and safely archive these logs on AWS S3 once they’re past the log retention period.
Moreover, Loggly offers unique features such as live tail to view real-time NGINX log events and pattern-based filtering to let teams focus on the most critical aspects of their servers and applications.
Datadog
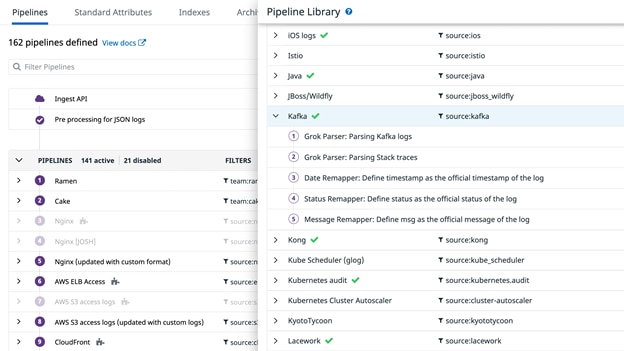
Datadog is a log analysis solution offering full visibility into servers and applications by monitoring and analyzing logs. It’s easy-to-use SaaS-based platform for cloud-scale organizations. The tool can collect, analyze, and archive massive amounts of logs. IT teams can also view and correlate metrics on its real-time intuitive dashboards. Additionally, Datadog can send instant alerts to notify teams about issues and outages as soon as it detects any errors. Other features of the tool include:
- Quick troubleshooting and open-ended exploration of data
- Dynamic indexing for security monitoring
- Log processing pipeline
Sumo Logic
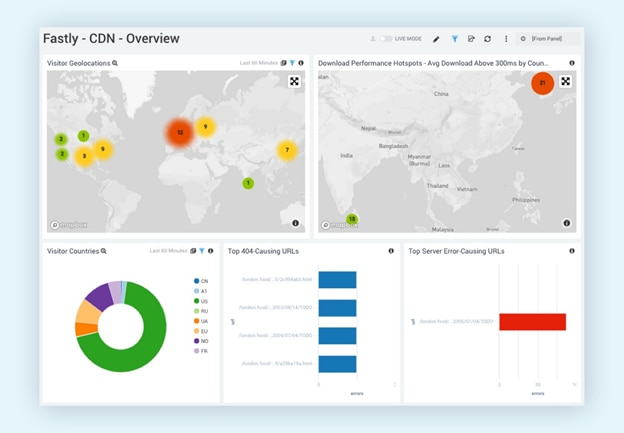
Sumo Logic offers an application to analyze NGINX server logs. In addition to analyzing NGINX server performance, the tool can monitor complex transactions and track usage patterns. It uses machine learning capabilities to efficiently analyze huge amounts of logs. The unified logging system enables developers to monitor and troubleshoot issues in real-time, allowing faster delivery of applications. Sumo Logic includes intuitive dashboards to provide a consolidated view of NGINX metrics. The tool can search logs using simple query language, making it easy to filter out irrelevant events and spot the root cause of application or infrastructure issues.
GoAccess
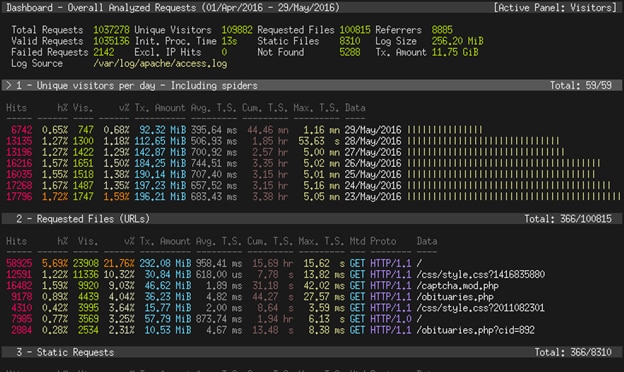
GoAccess is a free log analysis tool suitable for IT professionals who need quick access to real-time server data and reports. The program runs as a command line in Unix/Linux operating systems and can evaluate log formats including Nginx, CloudFront, Apache, Amazon S3, and Elastic Load Balancing.
Additional functionality includes real-time tracking of application response time, incremental log processing for data persistence, and display of multiple virtual hosts performances in a single panel with customizable schemes.
ELK Stack
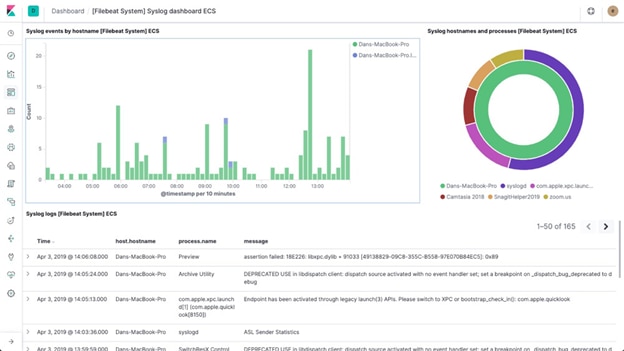
ELK (Elasticsearch, Logstash, Kibana, and Beats) is an open-source log management and analysis platform offering engineers an easy and effective way of monitoring NGINX logs in a highly distributed, dynamic, and noisy environment. The tool fetches log data through Kubernetes, MySQL, and more. This data is then indexed using Elasticsearch, helping you generate quick visualizations using Kibana.
ELK provides a centralized view for infrastructure operations and identifies trends using categorized logs with flexible data stream processing and powerful search from diverse sources.
Best Practices to Analyze NGINX Servers Efficiently
SolarWinds Loggly, an NGINX log analyzer, can simplify log analysis tasks to a great extent. However, to consistently tune and monitor NGINX servers for optimum performance and results, it’s important to consider NGINX logging best practices.
- Ensure end-to-end logging. End-to-end logging is critical to get an overall performance view of NGINX applications, servers, and systems. It helps you get a holistic picture of issues and user trends across components, so businesses can strategize to deliver a seamless experience in a distributed environment.
- Real-time analysis. Real-time visibility of the log data is important in case of production-level issues. It helps detect NGINX server and application issues instantly and enables developers to resolve errors faster before they turn into severe outages, helping eliminate service disruptions.
- Correlating log data. In today’s complex distributed IT environments, where logs are generated in massive volumes, it becomes daunting to keep a record of log events produced by several devices. Correlating data from various sources with the help of dedicated log analyzer tools helps in the quick identification of events. It also helps you build a plan of action to resolve issues in real-time.
- Standardize log formats. Development teams must focus on optimizing logging practices by creating a consistent log structure. Adding timestamp, context, user ID, standard date and time format, and log levels can help in quick detection of relevant logs. This makes the log data easy to interpret.
Conclusion
Today, organizations are making huge investments in cloud-based applications and platforms and still have a strong on-premises IT footprint. It becomes crucial to analyze and monitor application and server performance to ensure seamless delivery of services. Log management and analysis greatly help you visualize real-time insights into application and server logs.
As log management requirements vary based on the company size and industry, teams must choose a solution suited to their specific logging requirements. Highlighted above are some of the best NGINX log analysis tools available to help organize log data generated from distributed and complex environments.
SolarWinds Loggly is a simple yet effective tool that’s easy to configure and use. Its advanced integrations, log alerts, real-time insights, quick troubleshooting, and simple query language make it a reliable and safe log analysis solution. Experience it yourself with a free trial today.