
Sybase, the high-performing, enterprise-level Relational Database Management System (RDBMS) by Sybase Inc., is known for its efficiency, robustness, and scalability. This all-star database system is instrumental in managing large amounts of data while delivering high availability and security. But why is monitoring Sybase crucial? What are the best tools to get this done? Let’s jump right into it.
About this post
Monitoring your Sybase database helps you track the overall system performance, including query execution, transaction processing, and connection status. It enables proactive issue resolution before they impact system performance or business operations. Moreover, it provides vital insights into your database, allowing you to optimize and plan resource allocation effectively. And with the right tools, you can conduct this monitoring seamlessly.
In this post, we’ll explore the top-rated Sybase monitoring tools in the industry:
- SolarWinds Database Performance Analyzer (DPA)
- ManageEngine Applications Manager
- AppDynamics for Sybase ASE
- SQL Anywhere
- IDERA DBArtisan
SolarWinds Database Performance Analyzer (DPA)
(https://www.solarwinds.com/assets/solarwinds/swdcv2/licensed-products/database-performance-analyzer/images/product-screenshots/dpa-optimize-performance.png)
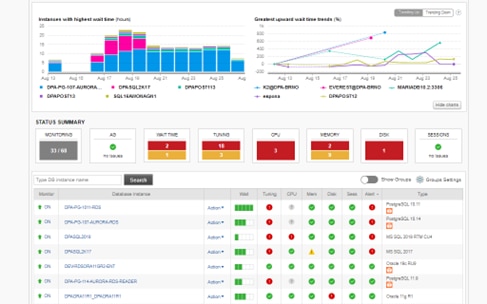
The SolarWinds Database Performance Analyzer (DPA) is a reliable tool for monitoring Sybase performance. It is highly regarded for its thorough performance analysis, easy-to-use interface, and extensive features.
The tool provides a detailed view of your Sybase database performance, making monitoring key metrics like response times, wait statistics, and resource utilization easier. Its intuitive interface is a standout feature, which converts complex data analytics into easily understandable and visually engaging representations. Whether you’re a database newbie or a seasoned DBA, you’ll appreciate SolarWinds DPA’s presentation approach.
What sets SolarWinds DPA apart is its multi-dimensional performance analysis. This feature helps you better understand your database performance by correlating SQL statements, wait events, and system resources. So, you’ll have the power to look at a problem from multiple angles before deciding on the best course of action.
SolarWinds DPA is equipped with anomaly detection and machine learning capabilities. These advanced technologies empower you to proactively identify and address potential performance issues, significantly reducing the risk of system downtime or sluggish performance.
Another impressive feature is its alerting and reporting system. With SolarWinds DPA, you can configure alerts to notify you about impending performance issues, and the reporting system allows you to generate comprehensive reports, including trend analysis and forecasting reports, thereby aiding strategic decision-making.
Finally, SolarWinds DPA offers integration capabilities with other SolarWinds products, allowing you to enjoy a seamless and integrated monitoring experience. This holistic approach can significantly simplify your IT management processes and provide more profound insights into your IT infrastructure.
ManageEngine Applications Manager
Regarding robust Sybase database monitoring solutions, ManageEngine Applications Manager holds a prominent spot. It is a comprehensive monitoring tool well-loved for its versatility, feature richness, and user-friendly interface.
ManageEngine Applications Manager lets you closely monitor your Sybase database’s health, availability, and performance. It provides real-time insights into key performance indicators such as cache hit ratio, transaction details, and lock statistics. These data points are invaluable for identifying and addressing potential performance bottlenecks on time.
One standout feature of the ManageEngine Applications Manager is its automatic corrective actions. This feature allows the system to take predefined corrective measures when it autonomously detects anomalies. This proactive approach can significantly reduce downtime and improve overall system performance.
The SQL Query monitor is another noteworthy feature. It helps pinpoint slow and expensive queries potentially affecting your system performance. With this feature, you can optimize your database queries to ensure they’re as efficient as possible.
The tool also excels in the presentation of data. It offers comprehensive reports and visualizations to simplify interpreting and analyzing performance data. These insights make data-driven decisions about your Sybase database a breeze.
ManageEngine Applications Manager’s alerting system deserves special mention as well. With this feature, you can set up personalized notifications according to specific thresholds, which guarantees you will receive timely alerts in case of any performance concerns.
AppDynamics for Sybase ASE
If you’re looking for a robust and reliable tool to monitor Sybase ASE (Adaptive Server Enterprise), AppDynamics is an excellent choice. It’s an enterprise-grade monitoring solution that offers real-time visibility into your Sybase ASE database, letting you closely monitor and analyze performance trends.
One of the standout features of AppDynamics is its sophisticated alert system. Unlike conventional alert systems, AppDynamics allows you to set custom alerts based on predefined thresholds. This ensures that you are promptly notified about any potential performance issues affecting your business operations and can address them proactively.
Adding to its appeal is the “drill down” feature. This option allows you to dive deeper into problematic areas of your database to identify the root causes of performance issues. Whether it’s a problematic SQL query or a system resource hog, AppDynamics gives you the means to uncover it swiftly and efficiently.
AppDynamics goes beyond just providing performance metrics. It allows you to visualize these metrics in the context of business transactions. This unique capability enables you to correlate database performance with business metrics, aligning your IT operations with business goals.
AppDynamics also stands out with its easy-to-use and intuitive dashboard, which neatly presents all critical performance data in one place. The dashboard includes visualizations designed to simplify interpreting complex data sets, making it easier for you to make data-driven decisions.
SQL Anywhere
Sybase’s SQL Anywhere boasts a suite of diagnostic tools designed for detecting and correcting performance issues. These tools employ a broad tracing infrastructure, including tables, files, and other components, to record and store diagnostic data. This data subsequently serves as the foundation for various diagnostic and monitoring tasks, such as application profiling.
One such method that aids in the effortless analysis of SQL Anywhere performance data is the Application Profiling Wizard. This wizard can be accessed through the Application Profiling mode in Sybase Central, and it not only automates the performance-checking process but also suggests improvements.
Sybase Central’s Application Profiling mode also houses the Database Tracing Wizard, a tool that allows for customizing performance data collection to observe particular users or activities. The Request Trace Analysis function complements this by enabling targeted diagnostic data collection on requests by specific users or connections.
The Index Consultant tool offers a deep dive into the database indexes, recommending potential enhancements. This tool can be utilized via the Application Profiling mode or as an independent tool.
Sybase Central also facilitates Procedure Profiling,aiding in measuring the execution time of procedures, user-defined functions, events, system triggers, and other triggers. To further assist with this, system procedures are available for implementation.
Finally, Execution Plans provide database-related information concerning a statement, visualized in Interactive SQL or with the help of SQL functions. The plans can be obtained in multiple formats and preserved for future reference.
IDERA DBArtisan
Rounding out our list of the best Sybase monitoring tools is IDERA DBArtisan. As a multifaceted database administration solution, DBArtisan goes beyond essential monitoring to provide a comprehensive suite of tools for effectively managing Sybase databases.
IDERA DBArtisan lets you keep your finger on the pulse ofyour Sybase database by providing detailed, real-time performance metrics. These include metrics related to SQL workload, memory usage, storage capacity, and more. With such crucial data at your fingertips, you can quickly identify and promptly address performance bottlenecks.
A key feature of IDERA DBArtisan is its capacity analysis and reporting. This feature helps you manage and optimize your database resources effectively. It offers comprehensive reports about your database capacity, allowing you to anticipate future resource needs and plan accordingly. This capability is essential for maintaining optimal database performance and avoiding potential system slowdowns or outages.
The tool’s Space, Memory, and Transaction Analysis are worth noting. These provide in-depth insights into space usage, memory consumption, and transaction statistics, helping you optimize these critical areas for peak performance.
Additionally, DBArtisan shines with its SQL Debugger. This feature allows you to troubleshoot and fine-tune SQL code, enhancing your database queries’ performance and efficiency.
What’s more, DBArtisan offers a user-friendly interface displaying all the vital data in an easily digestible format. This ease of use and clarity in presentation makes the tool an excellent choice for DBAs of all experience levels.
Summary
There you have it: the five best Sybase monitoring tools in 2023. Whether it’s SolarWinds DPA, ManageEngine Applications Manager, AppDynamics for Sybase ASE, SQL Anywhere, or IDERA DBArtisan, each tool offers a distinct set of features and capabilities to help you monitor, manage, and optimize your Sybase databases effectively. Now, it’s all about picking the one best aligning with your unique database monitoring needs.
This post was written by Juan Reyes. As an entrepreneur, skilled engineer, and mental health champion, Juan pursues sustainable self-growth, embodying leadership, wit, and passion. With over 15 years of experience in the tech industry, Juan has had the opportunity to work with some of the most prominent players in mobile development, web development, and e-commerce in Japan and the US.