
Devices enabled for using the Simple Network Management Protocol (SNMP) send out various SNMP messages to convey information. SNMP traps are a particular kind of message including information on alerts and problems. It’s important to be able to view and use these pieces of information when managing your data ecosystem, as they provide critical device information on metrics that could majorly impact performance and applications.
Using tools to view, interpret, and act on SNMP traps can be a good approach. For instance, SolarWinds® Log Analyzer helps you streamline how you use SNMP traps for network monitoring, and offers both log viewing and real-time troubleshooting tools.
What Is an SNMP Trap?
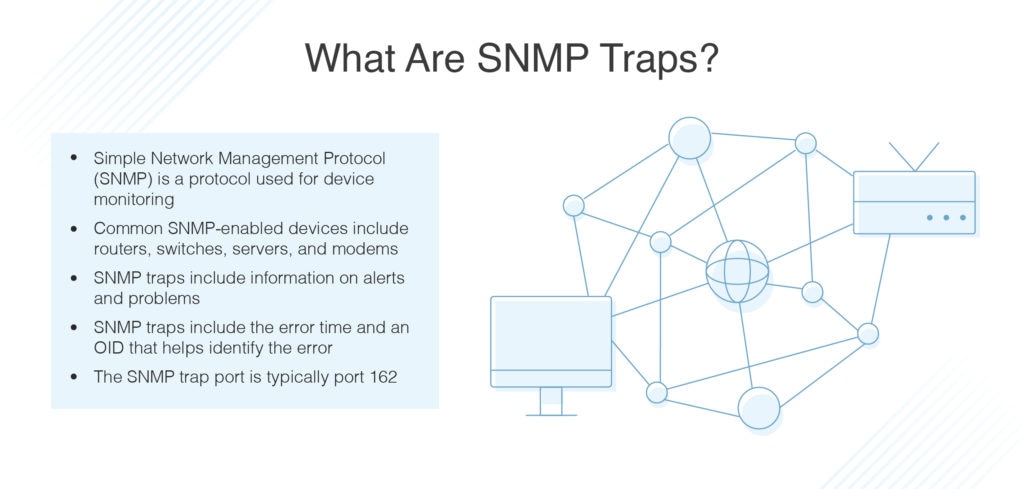
The first thing you might be asking is “What is SNMP?” Traps are a part of the way SNMP functions, but let’s begin with SNMP in general. SNMP is a widely-used protocol for network monitoring processes. When devices have SNMP enabled, information about those devices can be collected and analyzed to ensure they’re performing well. Commonly SNMP-enabled devices include routers and switches, servers, workstations, printers, and modems.
There are three parts of SNMP allowing it to function: a central SNMP manager, a device agent, and a management information base (MIB). The device agent is what allows you to turn SNMP on or off, and the MIB is the way in which the device information is structured and made accessible. The device agent also sends out signals to the manager.
The SNMP manager monitors devices to check what signals the device agent is sending out. In most cases, SNMP traps are one of these signals, or messages, SNMP-enabled devices send to the SNMP manager, particularly to alert an important event has occurred, such as a device overheating. This is essentially a warning or emergency message, so the manager can see a problem needs to be fixed.
An SNMP trap port is the port at which the manager receives the traps. This port is typically set as port number 162. However, you can change this port if necessary, and it may also differ depending on the SNMP manager you’re using.
One of the complicated things about SNMP traps is they’re not always effective at alerting you when major errors have occurred. For example, sometimes the device agent will send out an SNMP trap for a minor issue and miss a major problem capable of bringing your entire network down. For instance, if the device experiences a fatal issue shutting down the entire device, the SNMP agent can no longer work either (and no SNMP trap will be sent out).
SNMP traps are sent out in a particular format, showing a time, an identifier, and a value. The time shows when the error occurred. The identifier is from the MIB and is called an “OID,” also known as an Object Identifier. The OID represents an element of the device being monitored, such as temperature, CPU function, or memory (or even whether the printer ink is running low). These OIDs can help you to pinpoint the problem.
This information is critical when you’re monitoring a large network where a single device failure can cause a cascade of issues.
How to View SNMP Traps
One of the first things you need to understand about SNMP traps is if you aren’t viewing them or using them to inform your network monitoring approach, you’re missing a vital piece of the puzzle. If you’re wondering how to view SNMP on Windows, the best way is by using automated tools, but it’s possible to configure SNMP manually on some newer Windows devices, and it’s already installed on older systems. To turn on SNMP for many Windows devices, you can access the Programs and Features section of the Control Panel. On Windows Server, you can install the SNMP Service in the Add Roles and Features Wizard. On the Agent tab, you can check off all the services to incorporate SNMP data.
However, to easily collect and view information from across devices, your best bet is a flexible tool compatible with various device types and vendors. Whatever tool you’re using will likely have a specific dashboard where you can view SNMP traps as a log type. For example, some tools will have a dedicated application only displaying SNMP traps as an output. Other tools will require you to put in a command such as “view SNMP traps.” Some tools will have a process requiring configuration before you can view the traps, and so on. For your usability purposes, you should consider how the tool you want to use allows you to view the traps, and what format it displays them in. Your best bet is a tool that takes a user-friendly approach, but still allows for in-depth visibility if you need to investigate an issue.
How to Choose a Tool
There are many network monitoring tools out there capable of helping you view and use SNMP, and there are several different types of tools available. You also need to know how to check SNMP traps using whatever tool you choose. Choosing an intuitive and easy-to-use piece of software makes a big difference in the troubleshooting process, as using a difficult tool with a steep learning curve can end up slowing you down.
Whether for an enterprise or smaller business setting, one of the best tools I recommend is SolarWinds Log Analyzer. Log Analyzer acts as an SNMP trap receiver and can discover, search through, and display log files for a full overview of the events happening in your IT environment.
Log Analyzer supports several different sources of logs, including syslog, SNMP traps, Windows, VMware events, and Windows application log files. This means you can view SNMP traps in the greater context of your entire network performance and event data, which can provide a complete picture of any performance issues or problems in your network more generally. The broad support also means you can see these files in a centralized location, which makes the process faster and easier.
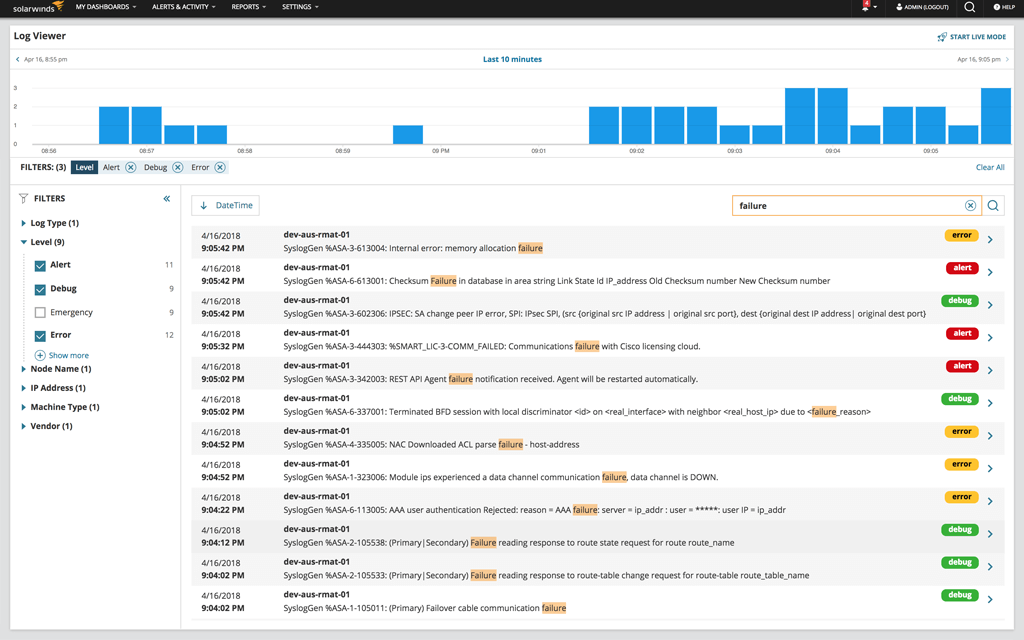
With regard to SNMP traps specifically, Log Analyzer doesn’t act as an SNMP manager, and doesn’t process MIBs. Rather, it listens for broadcasted trap messages. This way, you get the most vital information without any additional details you may not need. If you’re wondering how to view SNMP traps in Log Analyzer, you can view them through the “Trap Viewer” application and configure trap-specific alerts to let you know when an SNMP trap is sent out.
One of my favorite things about Log Analyzer is you can search through and filter the logs, which means if you’re looking for something specific or only want to look at one type of log, or logs during one time period, you can easily do so. This leads to faster troubleshooting and much more refined approaches to alerts and issues. This efficiency can lead to less downtime and reduce the impact on end users. This simple tool is easy to get up and running and is excellent for troubleshooting specifically.
You can also integrate Log Analyzer with the Orion®Platform, which is a SolarWinds solution allowing you to combine and integrate multiple SolarWinds products. This means if you want a broader network monitoring tool, or if you want to monitor IP addresses, VOIP, user behavior, web performance, databases, or virtual machines, you can combine products to create a centralized platform with everything in one place. You can try out Log Analyzer for up to 30 days for free.
In addition to Log Analyzer, there are many other paid or free tools you can check out, but be take caution when using free or open-source tools in a professional environment. They often don’t include support packages and may not integrate well with other tools or allow for expanded functionality.