
In this guide, I’ll define the basics of network latency—what it is, why it matters, and how measuring and optimizing network latency is important for any business. I’ll also dive deeper into the best ways to improve network latency. And while it’s possible to undertake manual latency testing, it can be time-consuming work better left to purpose-built solutions.
What Is Network Latency?
How Is Latency Measured?
How to Test Latency With Ping
The Limitations of Ping
How to Test Latency With Traceroute
How to Solve Latency Issues
Top 10 Latency Test Tools
1.Network Performance Monitor (Free Trial)
2.NetFlow Traffic Analyzer (Free Trial)
3.Network Bandwidth Analyzer Pack (Free Trial)
4.NetFlow Analyzer
5.Angry IP Scanner
6.Engineer’s Toolset
7.PRTG Network Monitor
8.VoIP & Network Quality Manager
9.NetScanTools
10.Flow Tool Bundle
Best Way to Check Network Latency
I compiled a list of ten of the best network latency measurement tools to give you a feel of what’s on the market today. I compare and describe why they differ as well as review their network latency features like Network Performance Monitor from SolarWinds, which is built to perform network latency tests to help save you time, energy, and stress while providing network insights so you know what you need to focus on to help improve your latency.
What Is Network Latency?
Latency refers to the speed of your network traffic, which is measured in milliseconds, with higher numbers indicating slower connections. What constitutes an acceptable latency range will vary not only network by network, but also application by application.
Devices and applications needing more network bandwidth, such as video or VoIP calls, will require lower latency ranges to function properly and efficiently. On the other hand, the less instantaneous nature of email delivery allows for a higher latency range when determining bandwidth priorities.
Part of the responsibilities of a network administrator includes deciding how to allocate bandwidth and resources to ensure users can do their jobs in a timely manner to help keep company operations running smoothly.
How Is Latency Measured?
As mentioned, latency is measured in milliseconds, and it can indicate one of two things depending on the metric used. There are two ways of measuring latency:
- “round-trip time” (or RTT), which calculates the time it takes for a data packet to travel from one point to another on the network and for a response to be sent back to the source.
- “time to first byte” (or TTFB), which records the time it takes from the moment a packet leaves a point on the network to arrive at its destination. RTT is more commonly used to measure latency, because it can be run from a single point on the network and does not require data collection software to be installed on the destination point (as TTFB does).
Skip to Top 10 Latency Test Tools List >>>
How to Test Latency With Ping
Ping is a free latency testing tool built into the operating system of every computer connected to a network. It works on the Internet Control Message Protocol (ICMP) and is often used by network administrators when diagnosing and troubleshooting internet connectivity issues. When it comes to how to measure latency, ping is a quick, simple, and effective tool: it doesn’t require any additional software, and it provides a report to the computer from which you run the command.
Here’s how a ping execution works:
When you run the command, your computer will send 32 bytes of data to your specified destination, then report the time, in milliseconds, it takes to receive a response signal—this is an example of the round-trip time measurement mentioned earlier. A ping command will give you the transfer time for both the test and response packets, which can be useful for determining whether the traffic issue is directional.
While it is a simple tool, ping includes a few useful features. You can ping IP addresses directly; however, you don’t need to know the destination IP address if you are checking the RTT to a website, because ping treats the domain name as an address. Ping sends four test packets by default, but you can customize this on the command should you need a different number of tests.
When you receive the return signal from the ping command, it shows the RTT for each test packet along with a few other data points. These include the number of packets sent, the number of responses received, and how many (if any) were lost. The results will also summarize the minimum, maximum, and average round-trip time for the batch of test packets, allowing you to assess latency fluctuations.
The Limitations of Ping
While ping is an excellent way to test a specific network path that seems to be slow or underperforming, it is a very stripped-down tool. Ping will not, for instance, help you fix any latency problems you may identify, nor does it let you check multiple network paths with a single command.
The good news: there are several latency test programs (some of which are listed below), and many offer a more sophisticated set of ping-based tools. These solutions can, among other things, test multiple network paths from the same console or even run continuous ping tests, which lets you see in real-time how latency is fluctuating.
How to Test Latency With Traceroute
Traceroute is a utility often used in conjunction with ping (or I recommend using this free, alternative to traceroute built to improve path analysis).
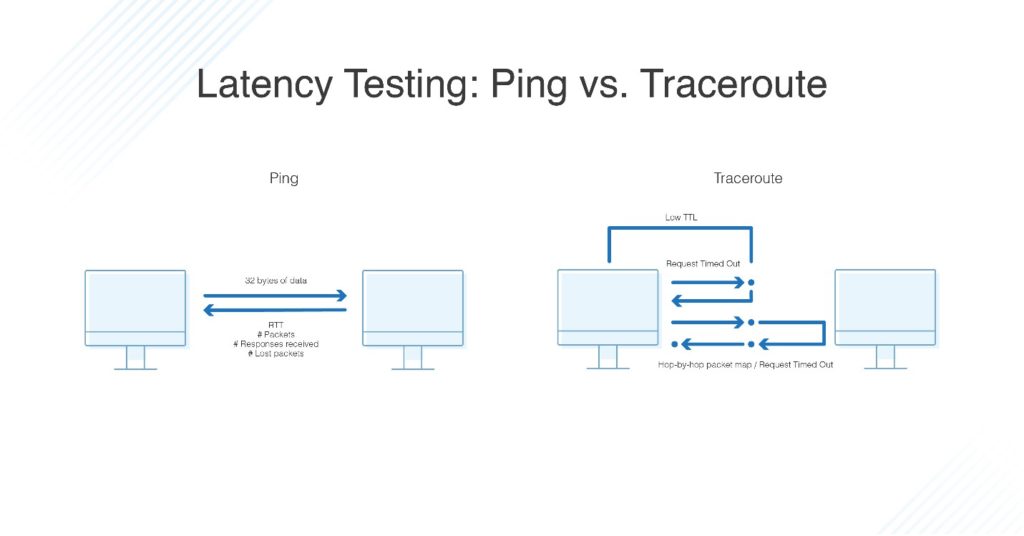
Whereas ping records the speed and latency of response packets, traceroute — as you might guess from the name—tracks the packet from the source to the destination, reporting back each of the hops the packet makes along the way. This can help you to identify what specific hops might be causing network trouble.
Traceroute does this by sending data packets with a low survival time (called “time to live,” or TTL), which limits the number of hops each packet can take before it’s returned to the source. If a packet times out before reaching the intended destination, then the intermediate node sends the packet back and identifies itself. Traceroute tracks the intermediate hops by increasing the TTL of the data packets and creates a “map” of the path across the network or networks, from source to destination. If one of the intermediate hops sends back a “Request Timed Out” error message, it indicates network congestion, which can cause connections to drop and webpages to load slowly.
How to Solve Latency Issues
Both ping and traceroute are excellent tools for diagnosing network latency, but neither one provides options for solving latency issues. One way to streamline network performance is through queuing algorithms and other traffic-shaping methods working to optimize network traffic flow. Quality of service (QoS) is a methodology for establishing hierarchies of importance regarding which types of traffic are given precedence over others. QoS processes function similarly to medical triage: the most pressing cases are given attention first, with the less urgent issues being put on the back burner. In terms of network data flow, this means prioritizing time-sensitive traffic, such as video playback or VoIP calls.
But by prioritizing certain traffic, other forms of traffic can experience transmission delays. Most network administrators would agree: pausing the transmission of an email for a few minutes to allow more time-sensitive traffic to move unimpeded across the network incurs a small cost—an often unnoticed one, especially when compared with the price of re-cabling your entire network to provide the bandwidth required for all traffic to constantly move at top speed.
Top 10 Latency Test Tools
There are a variety of latency checking tools available, from convenient, bare-bones tools offering augmented ping services to comprehensive tool bundles so you can track and customize a vast amount of information and metrics regarding your network’s performance. These can include factors like jitter—the variation of the arrival rate of data packets in a stream, which can be as disruptive as slow delivery—and available bandwidth on each stretch of your network. The latter metric enables you to track the potential capacity, average usage, and maximum usage of those paths, all of which is essential to know when planning for capacity requirements should your business need to scale up.
I’ve included several products that, in addition to software with the more standard ping latency tests, offer other tools (some free!) to enable you to test network latency in specialized ways depending on the application you are assessing (including VoIP, for instance).
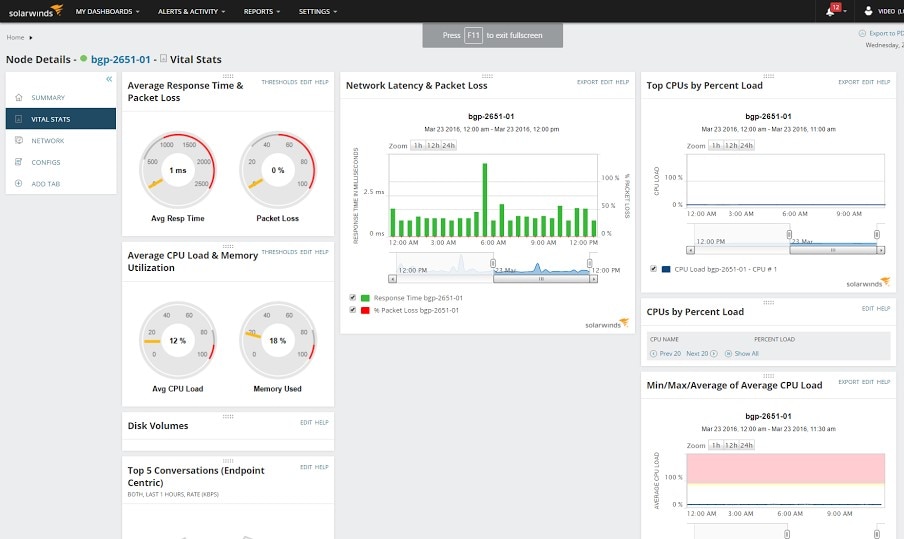
1. Network Performance Monitor (Free Trial)
Network Performance Monitor (NPM), one of the flagship products of SolarWinds, is an excellent tool for monitoring network infrastructure and all devices connected to the network. The software was written and designed by network and systems engineers specifically with the needs of other IT professionals in mind, making it a useful and adaptable toolset for network administrators.
Key features:
- various dashboards and interfaces – intuitive, easy to use, and customizable,
- ability to customize and create alerts based on different contingencies,
- drag and drop network performance metrics on a common timeline for side-by-side analysis,
- fully scalable.
Network Performance Monitor provides a vast amount of incredibly detailed information about bandwidth use across your entire network, which a skilled network administrator can easily use to identify bottlenecks and potentially congested places causing higher latency ranges. Using the Simple Network Management Protocol (SNMP), NPM periodically queries the devices on your network and computes their bandwidth usage, creating visual graphs to easily make sense of trends over time. The built-in network map features also let you examine the critical path between devices, which can be helpful when troubleshooting latency issues across specific paths.
One of the biggest benefits of a complete monitoring system like Network Performance Monitor is its network latency test feature, which allows you both to identify areas of the network experiencing latency and to determine how to solve the issues. Using data recorded by SolarWinds® NPM, you’ll be able to clearly see which network devices need the most attention. The advanced and extended features of the toolset also provide more information than augmented ping software regarding why users may be experiencing poor connectivity or lag on the network—useful knowledge to have, as slow data transmission isn’t always the network’s fault. Overall, Network Performance Monitor makes it much easier for network administrators to locate bottlenecks, congestion, and overloaded server CPUs.
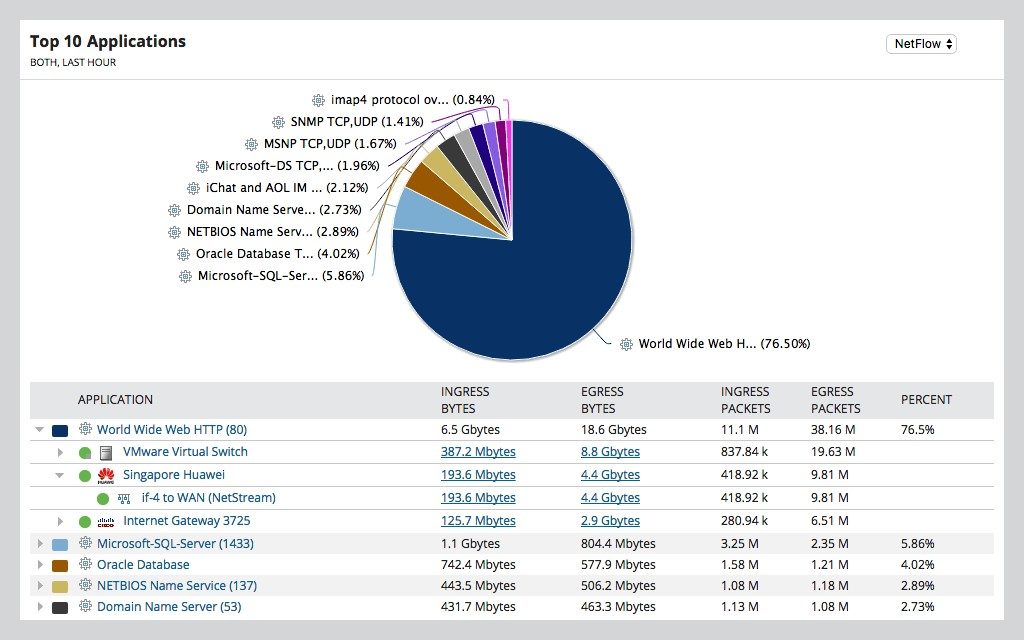
2. NetFlow Traffic Analyzer (Free Trial)
SolarWinds NetFlow Traffic Analyzer (NTA) offers a simplified, targeted view of your network’s performance by compiling information from observed traffic and bandwidth usage to identify patterns and trends. In addition, by locating the places across the network with either explicit or potential latency, it offers information and insights into what kind of traffic is being observed and who’s responsible for it.
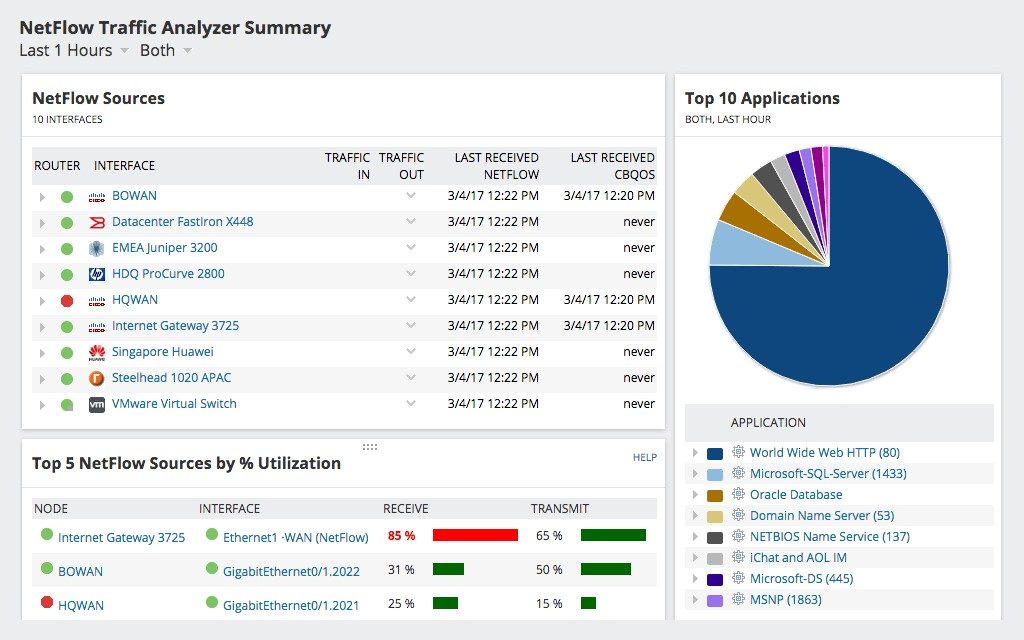
The tool monitors data transmission patterns to identify which users, applications, protocols, and IP address groups are using the most bandwidth, and can also be used to track conversations among internal and external endpoints—all of which is easily viewed through the program dashboard.
Whether you’re interested in minute-by-minute analysis or trends spread over months and years, NetFlow Traffic Analyzer collects and correlates data to give you micro- and macro-analysis of performance over time. Like Network Performance Monitor, it also lets you drag and drop performance metrics to quickly see how they compare to more quickly find root causes. Moreover, by creating a historical record of bandwidth usage, SolarWinds NTA assists you in planning for the future, giving you the data necessary to make informed policy decisions, prevent network outages, and avoid buying more bandwidth than your company needs.
If your company relies on VoIP and cloud applications and has implemented QoS policies and methodologies, NetFlow Traffic Analyzer provides useful before-and-after comparisons so you can determine the effectiveness of those protocols, and to help ensure the traffic with priority is moving as intended.
3. Network Bandwidth Analyzer Pack (Free Trial)
Since Network Performance Monitor and NetFlow Traffic Analyzer tools are designed to work in tandem, Network Bandwidth Analyzer Pack (BAP) gives you both solutions in one convenient bundle.
An ingenious strategy over at SolarWinds is the fact that many of their network management software products are built on a common platform, called the SolarWinds® Platform, so the tools integrate easily with one another and consolidate into a central view. This out-of-the-box functionality helps the tools improve and inform each other, giving you a more complete management system with a full range of network monitoring features.
4. NetFlow Analyzer
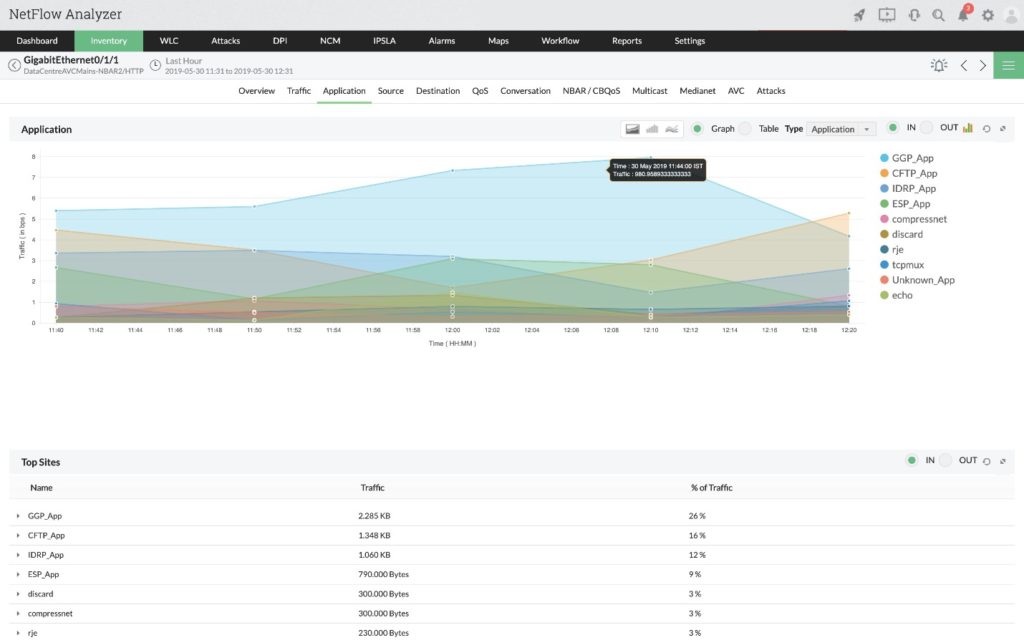
ManageEngine NetFlow Analyzer offers similar features and capabilities to SolarWinds Network Bandwidth Analyzer Pack. By monitoring your network bandwidth usage and performance in real time, NetFlow Analyzer makes it easy to identify issues and to preemptively address potential problems before they manifest and affect users on your network. This flow-based solution tracks usage by interface, application, and conversation, giving you detailed information about activity across your network. It also gives you control over your network bandwidth by allowing you to limit usage by non-business-critical applications.
The bottom line for many companies relies on a properly functioning network, so it’s imperative for any issues, including network latency, to be addressed and solved in a timely manner. NetFlow Analyzer allows you to monitor your network at large as well as specific departments, giving you insights to help reduce network latency and swiftly analyze the root source of potential issues. It synthesizes the disparate tasks required to manage and maintain a network’s optimal efficiency into one easy-to-navigate application.
Many of the network monitoring tools offer the ability to run reports on the network traffic data they collect. The reports you run are only as good as the analysis accompanying them, and while it might seem like a small addition, ManageEngine NetFlow Analyzer includes a report comparison feature to streamline the process of measuring and interpreting network performance data. This allows you to compare performance across multiple devices at the same time as well as for individual devices over time—from bird’s-eye views of an entire quarter to minute-by-minute performance. Having these different performance metrics is useful in identifying peak traffic hours and which devices are receiving the most traffic, which in turn can lead to insights during the troubleshooting process. The reports for all information related to specific devices over time periods you select can be consolidated and exported in both PDF and CSV formats. NetFlow Analyzer also includes security reporting, which helps you identify whether unusual behavior on your network is a security threat.
ManageEngine offers two versions of NetFlow Analyzer: Essential and Enterprise. The Essential version is a little more stripped down in terms of features, making it a more cost-effective option for smaller companies wanting a robust and effective toolset, but might not need the comprehensive and detailed monitoring systems Enterprise provides.
5. Angry IP Scanner
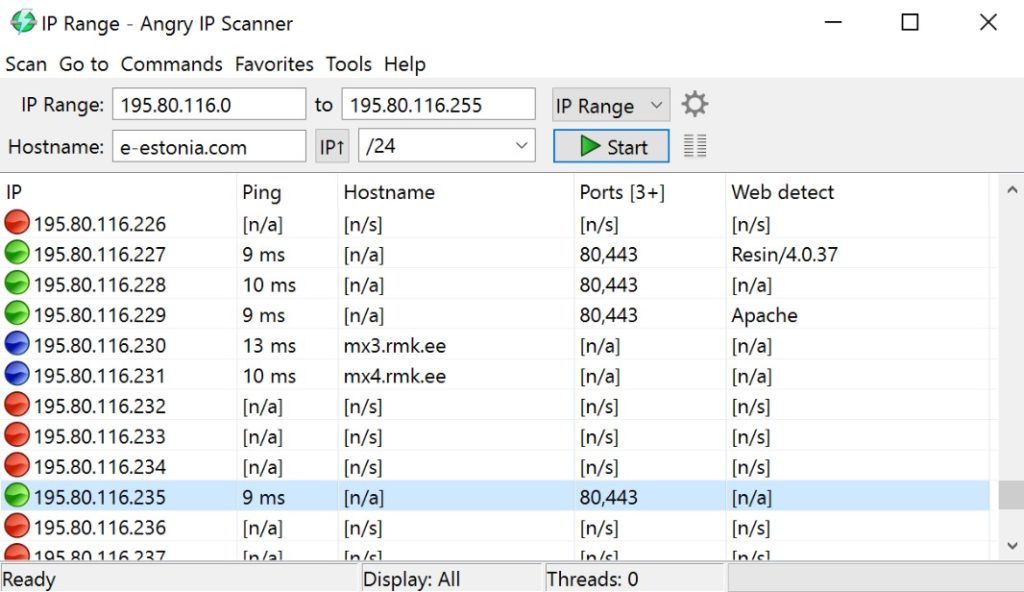
Angry IP Scanner is a free, lightweight, open-source IP address and port scanner compatible with Windows, Mac, and Linux operating systems. Featuring a clean and uncluttered user interface, Angry IP Scanner is incredibly easy and straightforward to use. It’s a relatively bare-bones tool, which means it’s not the ideal choice for large and enterprise-scale networks, but if you just need to scan your local network, it’ll take almost no time to launch Angry IP Scanner and start scanning.
The application uses multi-threaded scanning for swift performance and collects basic details about each device it discovers, including IP address, ping time, host name, and the number of open ports. It also offers several other optional fields, and the amount and type of data gathered by the scan can be modified and extended by incorporating plugins.
When running reports in Angry IP Scanner, you don’t have to manually parse the long lists of IP addresses. Built-in hotkeys let you quickly move between categories and execute actions, such as rescanning, deleting, or exporting the report. The open source element is unique, allowing anyone familiar with Java code to customize and tweak program functionality to suit their own needs.
6. Engineer’s Toolset
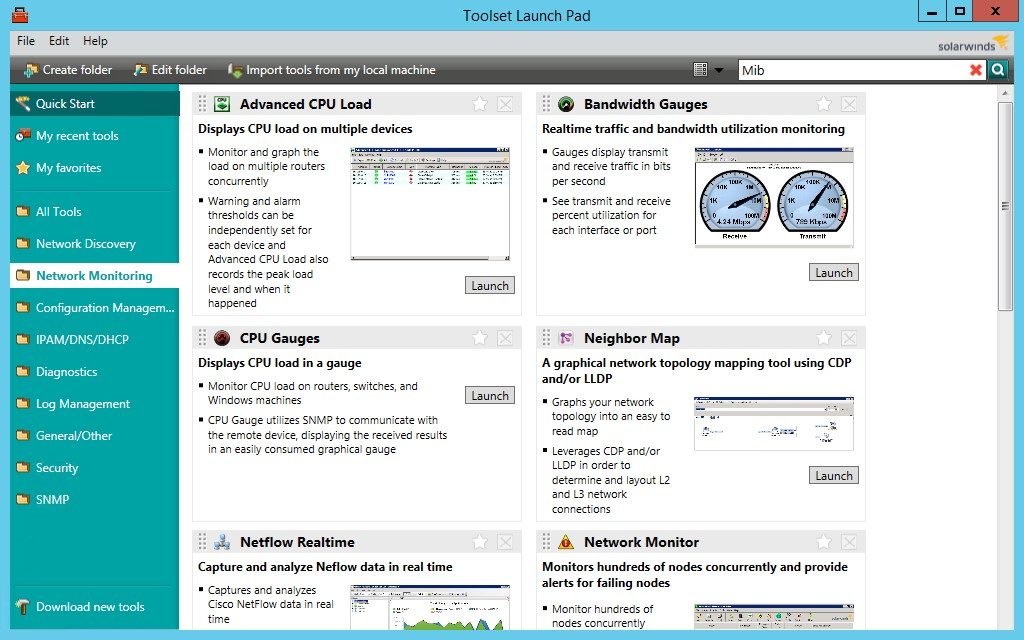
SolarWinds Engineer’s Toolset™ (ETS) includes more than 60 tools designed to help you manage and troubleshoot your network, including automated network discovery, real-time monitoring and alerting, useful diagnostic tools, and more.
For latency tests, several tools in SolarWinds ETS are designed to monitor bandwidth usage and device health across the network to provide diagnostics for troubleshooting and problem solving, some of which I’ll describe in more detail below:
- The Response Time Monitor in ETS allows you to monitor the availability of devices in real time and obtain latency and availability information in tabulated form
- The CPU Monitor tracks CPU load for multiple devices in real time and allows you to set warning and alarm thresholds for each device
- The Interface Monitor allows you to view real-time interface statistics for routers and switches
- The web-based traceroute utility lets you track specific network paths and analyze the performance and latency of each hop across those paths
While certainly not as robust as the features included in Network Bandwidth Analyzer Pack, Engineer’s Toolset offers several useful network management tools in one convenient solution.
7. PRTG Network Monitor
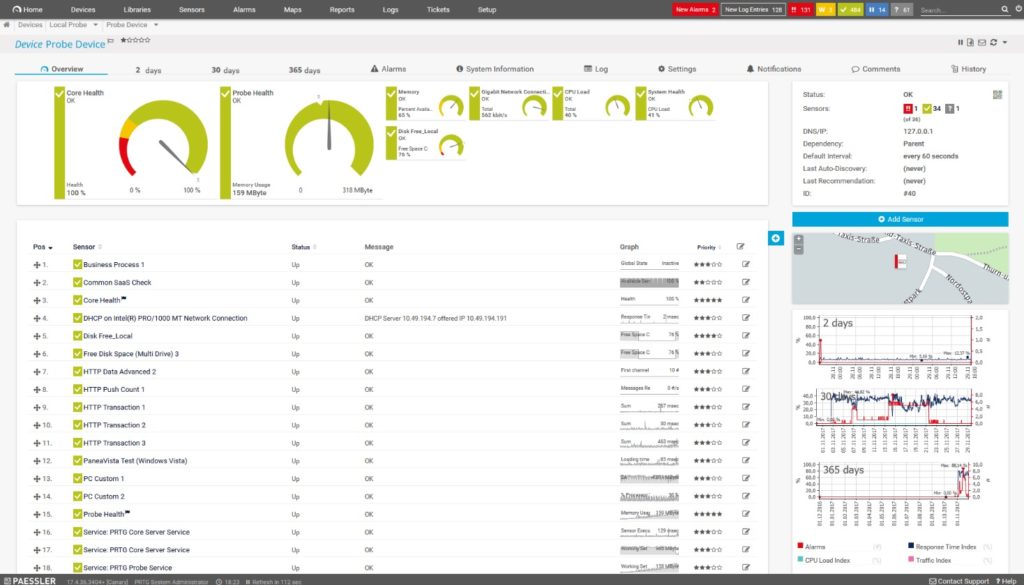
Another comprehensive monitoring application, Paessler PRTG Network Monitor is a good option for medium or large businesses with a substantial number of servers, switches, and firewalls in need of monitoring, as it allows you to do so from a single platform. This has the benefit of allowing you to visually assess patterns related to network performance and to consolidate your alerts in one centralized location.
PRTG monitors everything on your network, from traffic, bandwidth, and uptime to disk usage, IoT devices, and cloud services. There are a variety of pricing plans available, each offering a different number of network sensors to make sure you’re getting the best network monitoring system for the size of your company. The monitoring system is proactive and extensive, offering more than simple Ping-based queries. Sensors monitor CPU usage, hard drive space, memory, and even specific processes. Like SolarWinds Network Bandwidth Analyzer Pack, PRTG offers detailed customizable macro- and micro-level analysis that won’t overwhelm, and it builds a record of historical data regarding network performance and latency. This allows you to track over time which servers and devices require more resources and to reallocate bandwidth for optimized performance.
PRTG also includes an autodiscovery feature, meaning it will discover new systems or changes to the network and automatically apply sensor templates, ensuring each new device is monitored for CPU, RAM, hard disk, and network capacity as soon as possible. The preset templates are streamlined, economical, and efficient. As with Network Performance Monitor, PRTG comes with a robust dashboard system to let you visualize your network performance in real time with color-coded maps. The map designer function integrates data from all your network sensors and sorts it according to various metrics, including by device type or by traffic. Your network maps can be tailored with custom HTML, and can even be shared both within and outside of your company networks, if needed, by using unique dashboard URLs.
One drawback of PRTG Network Monitor is it uses a proprietary database, not a more standard format like MySQL or Microsoft SQL. This can occasionally cause some compatibility issues, and it prevents network administrators from writing their own SQL queries against the database.
8. VoIP & Network Quality Manager
SolarWinds VoIP & Network Quality Manager (VNQM) is built to provide insight into network latency through the lens of VoIP and call quality. Using this tool, you can monitor both call performance and WAN performance, tracking metrics like jitter, latency, Mean Opinion Score (MOS), and test packet loss. Compiling data from these metrics can help network administrators determine the quality with which VoIP calls are being delivered.
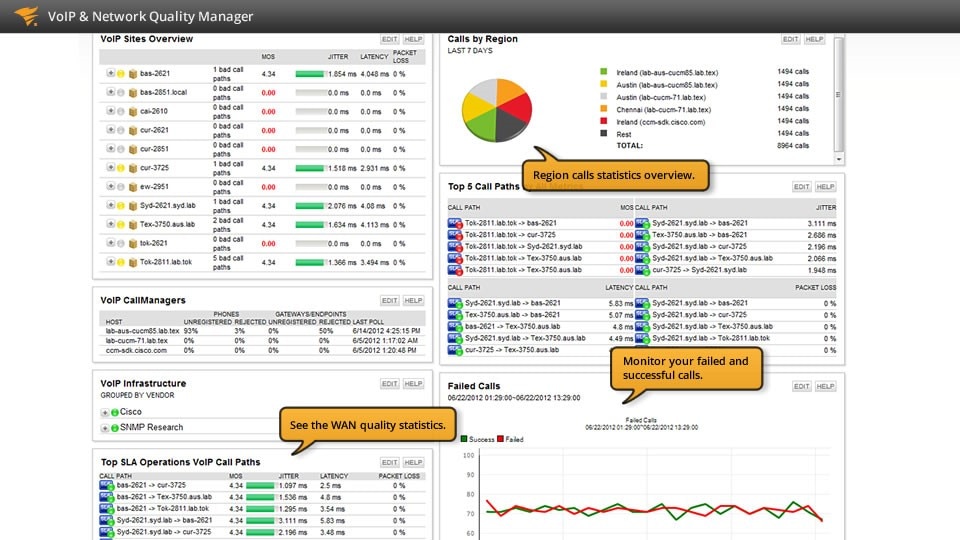
VoIP & Network Quality Manager provides the unique ability to view and search for individual calls. The tool logs metadata like call origination, call destination, call manager, call time, call status, and call quality, so should you need to troubleshoot an issue related to VoIP, you will have records to help you determine what’s leading to poor performance on your network. This aids in the problem-solving process and helps prevent VoIP call downtime.
SolarWinds VNQM features a clean and intuitive user interface. It also designed to be deployed in less than an hour, as the platform uses SolarWinds auto-discovery technology to identify Cisco IP SLA-enabled devices across your network. This saves you the hassle of having to manually configure each device individually.
The tool is built to provide basic VoIP and network monitoring, though it will not monitor routers, switches, or bandwidth utilization. But the program provides a lot of information in easy-to-understand dashboards, including defined paths between offices and monitoring for latency, jitter, and packet loss at each network hop.
VoIP & Network Quality Manager is helpful because it lets you drill down to focus on data related to specific sections of the network. The ability to access IP SLA and call-path monitoring means you can drill down on specific operations and call paths to see if issues occurred during the call and to troubleshoot the problem more quickly.
The alerting system in VNQM offers several options you can personalize, as well. If call paths begin to experience performance issues, network administrators can choose to be contacted by email, text, script, or other method, so they’ll be able to swiftly get to work to prevent latency or call-path issues from affecting users. VoIP & Network Quality Manager also offers alert triggers based on adjustable contingencies and conditions you can personalize, ensuring the right people are notified when certain thresholds are met.
While it’s an excellent tool to help troubleshoot VoIP rollouts, VoIP & Network Quality Manager only works for Cisco-based systems (but that shouldn’t really be a problem, because who doesn’t use Cisco devices in this space—am I right?).
9. NetScanTools
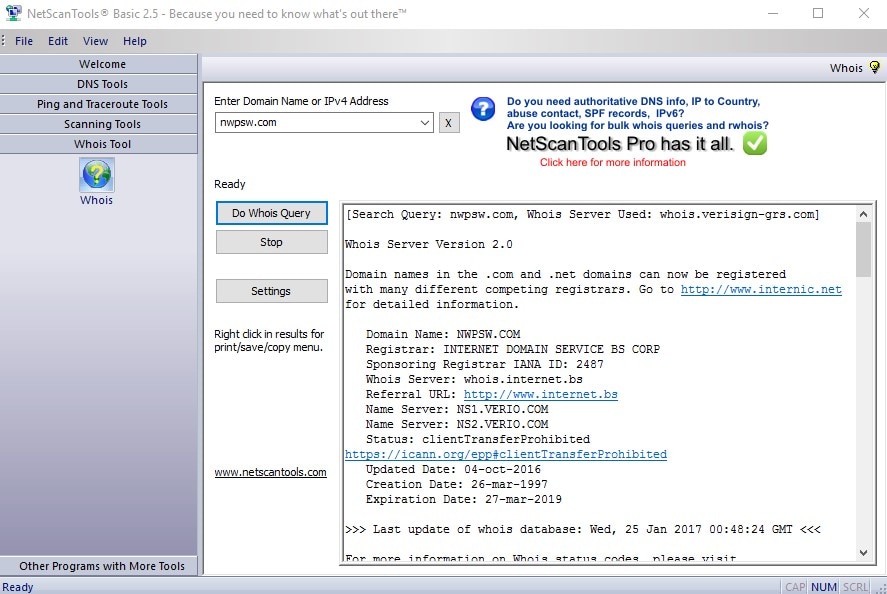
NetScanTools comes in Basic, LE, and Pro packages, each of which offers network monitoring tools. The NetScanTools Basic edition is another freeware option for home users and those managing smaller networks, giving you several powerful networking tools in a single bundle. The LE package is designed specifically for those working in law enforcement and was created with input from actual law enforcement professionals—resulting in a program oriented around “cases.” All queries are automatically documented, time-stamped, and logged, and the reports generated by the application are unfussy, direct, and results-driven.
NetScanTools Pro brings more than 40 networking tools—including configuration functions, security testing services, tools for data gathering, and network and service diagnostics—into one central interface. NetScanTools collects a lot of data automatically and is specifically designed to save you time. A great deal of information can be gleaned from examining DNS entries, scanning hosts, and doing Whois lookups, but running those tasks individually is time-consuming. NetScanTools creates automated reports to provide a range of detailed information, including not only Whois records and DNS details, but also blacklists, traceroutes, port scans, and more. Testing and packet tools allow you to illuminate potential problem areas on the network, as well.
While not as expansive or comprehensive as some of the other applications listed here, NetScanTools is a cost-effective and affordable bundle of network management tools. However, it’s only available for users running Windows systems.
10. Flow Tool Bundle
Designed for use with NetFlow, this free network testing toolkit includes three handy, easy-to-install network traffic analysis tools to give you the capacity to rapidly distribute, test, and configure flow traffic. SolarWinds combined two of its popular NetFlow free tools and added a new, third freebie not available outside this bundle to round out many of the features needed to gain important NetFlow performance insights.
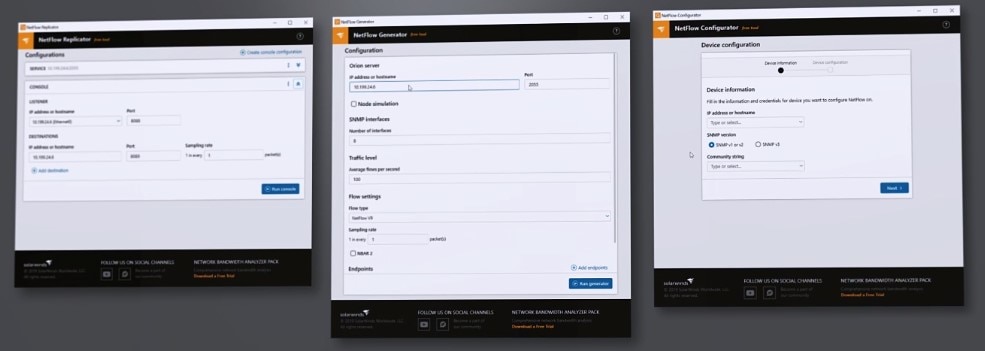
The three applications included in the SolarWinds Flow Tool Bundle are:
- NetFlow Generator – Simulate extra traffic on your network to see how your load balancers, firewalls, and network performance monitoring alerts respond when put to the test. This can also help you validate and adjust your network configurations.
- NetFlow Configurator – Configure NetFlow v5 via SNMP on Cisco devices and routers quickly and remotely, giving you an interface through which to specify which traffic the device should sample. The records are sent to locations you select, which enables them to get picked up by your NetFlow collector, too.
- NetFlow Replicator – Perform general-purpose flow analysis or security analysis by sending a stream of network flow data to specific destinations. This can help you determine the capacity performance of certain links and paths on the network, while also being a great opportunity to test the abilities of your network equipment.
With SolarWinds Flow Tool Bundle, you can track packet headers as they pass through each router, allowing the system to aggregate traffic data into parseable summaries. You can then run packet headers through the network again, to assess if or to what extent the performance of your equipment influenced network latency. In addition, you can generate extra traffic in the form of services and endpoints across your network to test performance and latency.
While these three applications give you some capacity to perform network latency testing, they are stripped-down network traffic tools and don’t include the streamlined graphic dashboards of the more comprehensive paid products, nor are they meant to take the place of the full-functionality of a tool like Network Bandwidth Analyzer Pack.
Best Way to Check Network Latency
The best way to check network latency will depend on the requirements of your business, including the size of the network, the metrics needed to keep it running optimally, and cost. While the most comprehensive of these tools will probably be more cost-effective for larger companies, many allow you to test other elements on your network in addition to latency.
I recommend using the tools included in Network Bandwidth Analyzer Pack to both monitor network traffic flows as well as the health of devices across the network, giving you the ability to better anticipate and address network latency problems.