
As modern IT networks move away from physical systems and toward virtual ones, administrators have to adapt their monitoring and management processes. Standard network monitoring operations are becoming increasingly obsolete, as businesses adopt Microsoft Hyper-V tools and performance monitoring solutions to keep pace with virtual infrastructure.
Hyper-V is in widespread use, with a significant number of enterprises using it to deliver virtual services. The more popular Hyper-V becomes, the more Hyper-V management tools emerge on the market. This gives network administrators a range of options; however, choosing between them can be difficult. You might be tempted by a free tool, only to find it can’t meet your business-grade requirements. Or you might be convinced by an open-source Hyper-V resource monitor but discover the user interface isn’t intuitive and technical support is scarce.
Even with paid Hyper-V tools, there’s no guarantee they’ll be the right fit for you and your company. There are several factors to consider when choosing among the available Hyper-V management tools, including user-friendliness, cost-effectiveness, suitability to business use, range and sophistication of features, and dependability of the vendor.
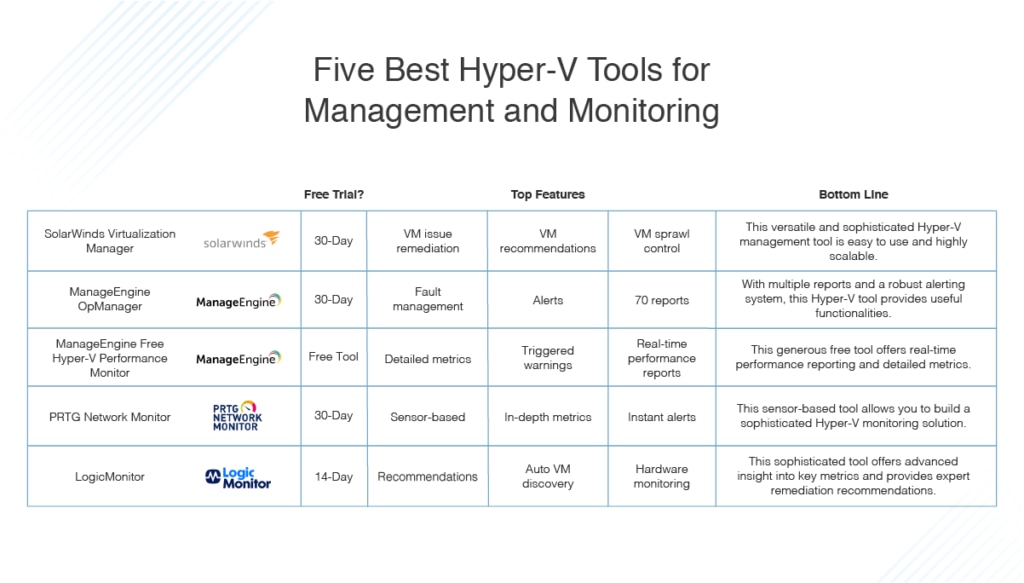
This guide will provide an overview of the best Hyper-V tools on the market, starting with SolarWinds® Virtualization Manager (VMAN). SolarWinds is well known among network administrators for its Network Performance Monitor, one of the most popular network monitoring platforms currently available. The vendor has a reputation for delivering high-caliber tools that are user-friendly, advanced, well supported, and cost-effective. VMAN is no exception: it delivers a range of enterprise-grade functionalities, including visibility across your whole application management stack and rapid troubleshooting. A 30-day free trial is available.
What Is Hyper-V?
The Importance of Hyper-V Monitoring Services
Best Hyper-V Tools
The Best Hyper-V Monitoring Solution
What Is Hyper-V?
Hyper-V is a virtualization platform, also known as a hypervisor, developed by Microsoft. It enables administrators to make the most of their hardware by virtualizing multiple operating systems so they run simultaneously off the same physical server.
Hyper-V debuted in 2008, when virtualization was a new concept. Very few people knew what it was, and most found it difficult to understand. In its early days, virtualization was complicated and tricky to implement, but in just a few years, that has drastically changed—today, virtualization is everywhere. Developers, cloud providers, and data centers depend on it. Hyper-V has been evolving rapidly and is gaining ground on its major competitor, VMware ESXi. There are numerous versions of Hyper-V available, including Hyper-V Server 2012, 2012 R2, 2016, and 2019.
The Importance of Hyper-V Monitoring Services
Before reviewing the best Hyper-V tools, let’s first consider why they’re so important and what benefits they can bring to a network administrator’s activities. The obvious reason Hyper-V management tools are required by administrators is Hyper-V services are virtualized. This means that, unlike physical infrastructure, they cannot be accessed directly.
In a single device, there can be multiple virtual machines (VMs). Because these machines are virtual, keeping track of them can be difficult, and you may find yourself missing issues indicative of performance problems. With a Hyper-V resource monitor, or a network monitoring program supporting Hyper-V monitoring, you gain increased visibility and insight into these virtual services.
Although Hyper-V offers certain built-in features by default, IT professionals might adopt a third-party program for monitoring to gain additional platform functionality. This could be in the form of report generation, which can substantially streamline the process of resource allocation.
Hyper-V tools can be used to report on activity and performance monitors, giving you visibility into traffic generation and allocation to single virtual hosts. The ability to allocate resources in a dynamic and informed way, while maintaining visibility of resource availability and limitations, is key to any systems capacity position within an organization.
Hyper-V management tools and Hyper-V monitoring services are likely to have other added functionalities, like advanced metrics, which can make using Hyper-V significantly easier and more efficient. Without effective Hyper-V tools, overlooking virtual resources is all too easy, and can result in performance issues and vulnerability to cyberattacks.
Best Hyper-V Tools
The following Hyper-V tools can augment your monitoring capabilities, helping you maintain optimum performance and security.
SolarWinds Virtualization Manager
I rank SolarWinds VMAN highest on this list of the best Hyper-V tools for a number of reasons. It’s versatile and comprehensive, covering every aspect of virtual machine monitoring. With a focus on optimizing performance and troubleshooting and rectifying problems, VMAN is highly recommended for any IT professional or administrator who wants to make their processes more efficient.
This guide will focus on the best capabilities of VMAN, but it’s worth noting this is by no means exhaustive. In fact, VMAN has more than 15 use cases, which can be viewed in greater detail here.
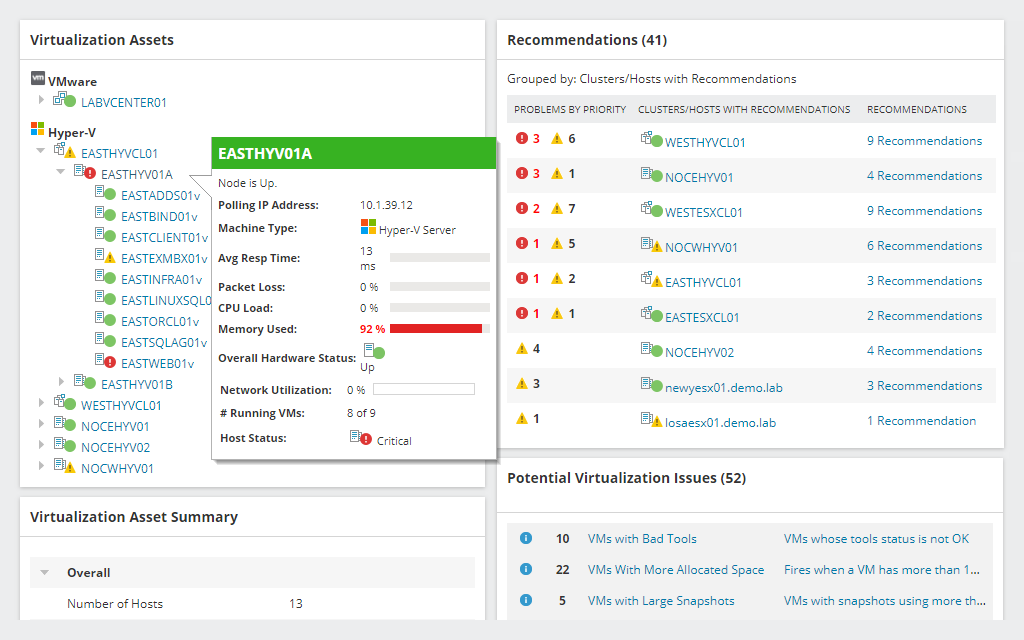
One of the best things about VMAN is it minimizes manual intervention. In just a few clicks, you can gain insight into the capacity, performance, and usage of your virtualized systems. This includes VMs, clusters, containers, hosts, virtual storage area networks, and alternative datastores. The VMAN monitoring solution assists with the remediation of virtual machine problems, without requiring you to log in to a hypervisor, by offering built-in management actions. This means you can perform management tasks and processes from within the program itself, saving you time.
VM recommendations are another notable VMAN feature. With these recommendations, otherwise known as actionable intelligence, you’re afforded expert insight into optimal VM size and placement. This assists you with optimizing virtual machine performance and allocating resources.
You can select individual recommendations or use multi-select to implement several simultaneously. You are given the choice of running these immediately or scheduling them for a later date. The ability to access actionable advice via a single interface reduces the need to switch between tools and browsers.
VMAN features VM sprawl control, which lets you power down idle VMs and delete powered-off VMs. In addition, you can delete VMDK files and snapshots, which lets you reclaim resources. With the VM sprawl tool, you can also ensure the optimal performance of your VMs by rightsizing any over- or under-allocated ones.
This Hyper-V management tool also serves as a powerful capacity planner. With VMAN, you can predict memory, CPU, network, and storage needs for both Microsoft Hyper-V and VMware vSphere. With the ability to run modeling scenarios at your disposal, you can gain invaluable insight into how best to support your new workload. VMAN even lets you run checkups to certify resources are aligned with present usage.
If you’re wondering how to check Hyper-V resources, this is the tool for you. With VMAN, all your Hyper-V resource metrics are centralized. The all-encompassing view of shared storage and silos gives you a comprehensive perspective. You can measure all critical storage metrics, including throughput, read/write, and IOPS.
One of the tool’s most advanced capabilities is dependency mapping. VMAN was intended to serve as a way of placing objects on a dependency map, so you can visualize how they relate to each other. With this Hyper-V monitor tool, a “time travel” component gives insight into a complete historical account of infrastructure relationships and VM configuration metrics. In addition to assisting with the identification of historical dependencies from specific time periods within your Hyper-V environment, this feature can be used to identify specific machines in your operating system, such as VMs belonging to a host two weeks earlier, or VMs that created the most I/Os.
VMAN features a Hyper-V resource monitoring component, which brings a range of benefits to the table. One such benefit is the prevention of bottlenecks. Bottlenecks are a regular problem for companies, especially those running virtualization programs. You may find yourself facing inadequate hardware resources or low storage space, which can cause performance problems. VMAN offers dynamic and intuitive graphs to help you understand VM traffic generation and instances of high usage.
As with all SolarWinds tools, VMAN’s dashboard design is a major benefit. The dashboard is fully customizable and equipped with alerts, keeping you informed of any VM performance issues—e.g., datastore latency, high CPU utilization, phantom snapshot files, and memory ballooning. The dashboard alerts can be customized at different Hyper-V infrastructure levels, including at the level of the VM, the host, and the cluster. VMAN includes a preconfigured dashboard to recommend actions for troubleshooting and performance management, as well as provide critical warning notifications from the offset.
A 30-day free trial of VMAN is available for download here.
ManageEngine OpManager
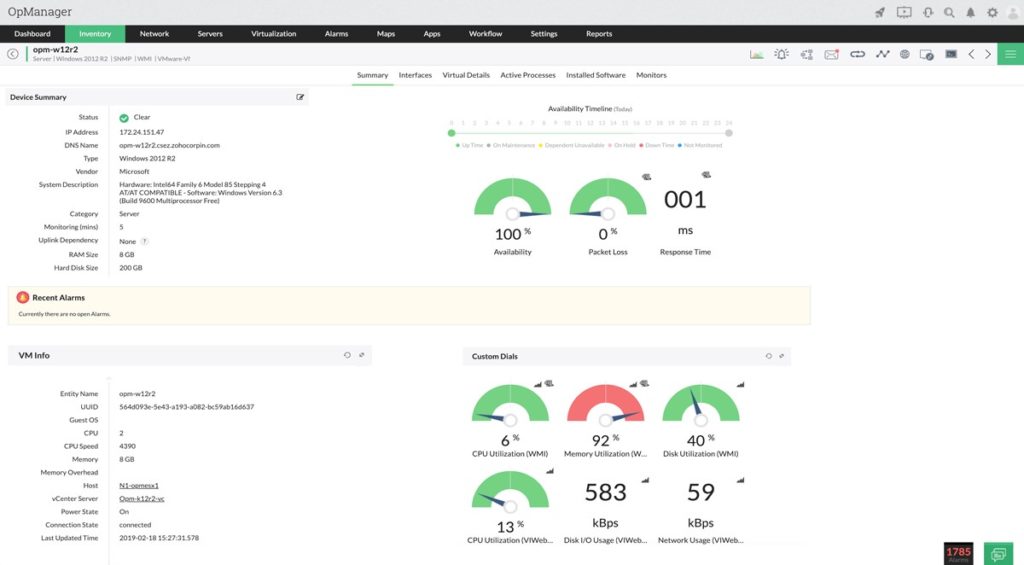
ManageEngine OpManager is a popular network monitoring tool with VM monitoring capabilities. The most noteworthy of these is auto-discovery, which automatically identifies Hyper-V infrastructure. When a device is discovered, you can then use more than 40 monitors to track your Hyper-V server’s key metrics, covering disk, memory, and CPU.
OpManager provides Hyper-V monitoring services for tracking inventory and allocated resources, reducing unnecessary proliferation of VMs within your data center. These features afford you maximum visibility, inform capacity planning, and contribute to successful troubleshooting of performance issues. The tool’s out-of-the-box performance and availability monitoring functionalities also assist with capacity planning by providing critical insights and recommendations for how VM performance could be improved.
This Hyper-V tool also includes more than 70 reports designed specifically for Hyper-V infrastructure. Reports are fully customizable, letting you select the data you want to share with your team, and can be exported to XLS, CSV, and PDF. There are an impressive number of reporting functionalities, allowing you to generate highly tailored and specific reports. For example, you could create a report of the least- and most-utilized hosts.
ManageEngine OpManager features an alerting system, which keeps you notified of any Hyper-V issues, like a resource becoming unavailable. Alerts can be sent via email or SMS, and all live alerts can be viewed via the fault management module of the program. This alert viewer gives insight into the severity of the issue and the time it was most recently updated, in addition to a supporting message with details.
These real-time alerts allow you to conduct rapid and informed troubleshooting processes when something goes wrong. When combined with OpManager’s self-healing scripts and workflow automation, alerts can be made instantly actionable.
OpManager supports Hyper-V and provides workflow automation utilities for VMware. This lets you perform ongoing fault remediation and maintenance activities on VMware servers. You can monitor your VMware server for events, and the program will automatically implement workflow actions according to preconfigured trigger profiles. This significantly reduces the need for manual intervention.
OpManager is available for Linux and Windows. Three versions of the software are available—Standard, Professional, and Enterprise. You can view the differences between the editions and download the tool here. A 30-day free trial is available.
ManageEngine Free Hyper-V Performance Monitor
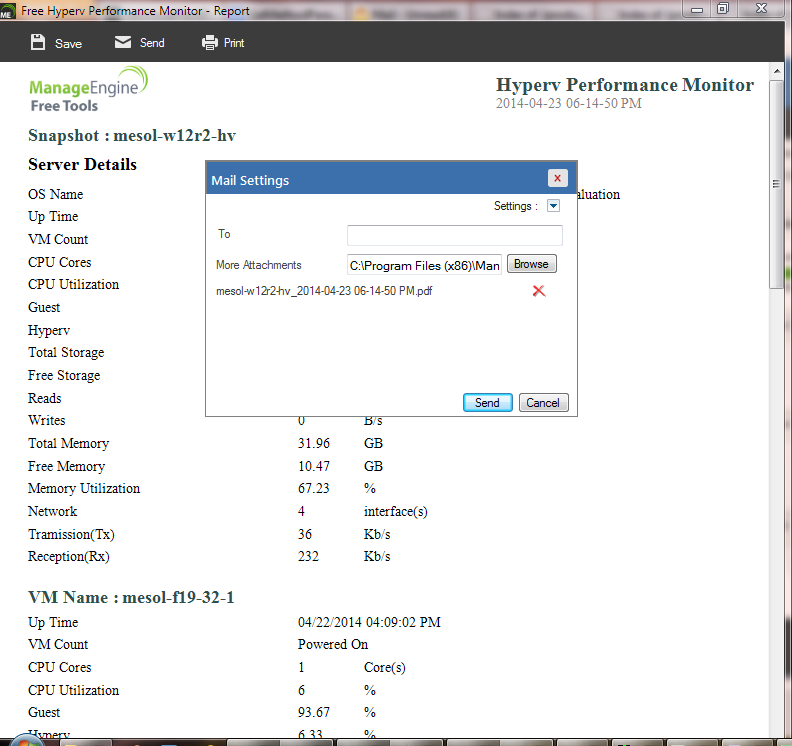
Hyper-V Performance Monitor is ManageEngine’s free alternative to OpManager. It was designed to monitor Hyper-V servers and the virtual machines running on them for memory, CPU, disk read/write, and network Rx/Tx traffic. With this program, you can monitor two Hyper-V servers simultaneously, for free.
Hyper-V Performance Monitor provides in-depth and detailed metrics. The tool gives insight into the number of virtual machines present, CPU usage and distribution for each VM, and details of storage, memory, and network utilization for each guest VM installed on the ESX host. Key metrics, like CPU usage and distribution, are displayed in graphs accompanied by color-coded alerts to keep you informed.
Another useful feature is the ability to check if VMs are powered off or on and observe the severity of a VM’s current status as either warning or critical. This is informed by customizable threshold values, which allow you to define when a CPU utilization value triggers a “warning” status, and when it triggers a “critical” status. You can also set automatic refresh intervals, so the user interface refreshes periodically and displays the most up-to-date performance data. Moreover, from within the settings, you can ensure server credentials are retained and set thresholds for subsequent restarts.
Although this tool doesn’t offer the same degree of advanced reporting capabilities as OpManager, it has a few noteworthy reporting features. These include the generation of real-time performance reports on VMs and hosts, in addition to the ability to print and/or email reports to key parties, like stakeholders. Reports can capture details of uptime, OS, CPU, memory, disk utilization, and VM count. You can export reports in PDF format.
Notably, unlike OpManager, this tool can’t monitor critical resource performance on Hyper-V host/guest instances. It also can’t track inventory and allocation of resources, nor does it generate especially in-depth performance reports or provide instant alerts. For these added functionalities, the premium version—ManageEngine OpManager—is required.
You can access this free tool here.
Paessler PRTG Network Monitor
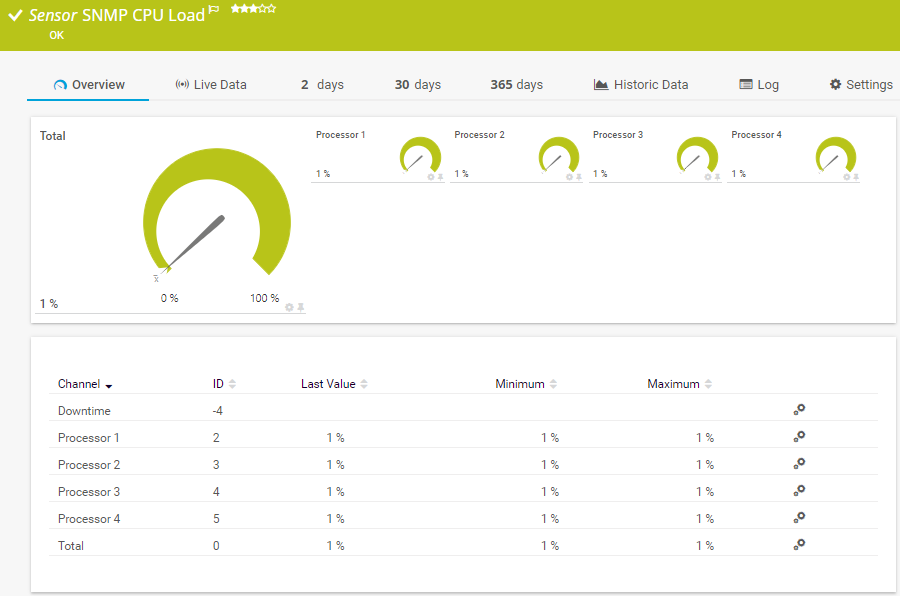
PRTG Network Monitor, by Paessler, offers a sensor-based approach to network monitoring. This solution features thousands of monitoring sensors for you to choose from, including monitors for CPU usage, memory, status, and even Hyper-V server traffic. There are several sensors dedicated to monitoring Hyper-V servers. These include the Hyper-V Host Server Sensor, which monitors the number of host health-critical values, CPU utilization and network traffic, and the number of deposited pages.
PRTG is a sophisticated tool, and the Hyper-V server sensors are notably advanced. These sensors monitor your virtual machines and their hosts in real time, to deliver in-depth metrics. The data extracted is then organized and displayed in the form of neat dashboards, which can be customized to suit your needs. This centralizes all your important Hyper-V data, informing future planning, testing, and monitoring of virtual environments.
With instant alerts, PRTG keeps you informed of any issues with your virtual environments. Since it’s quick and easy to set up and configure, it’s great for those with little experience, or who are just getting started with Hyper-V monitoring processes.
The Hyper-V Virtual Machine Sensor is another PRTG monitoring sensor for Hyper-V. This sensor monitors the read/write values and CPU usage of virtual machines running on a Hyper-V host server. The Hyper-V Virtual Storage Sensor, meanwhile, monitors the error rate and read/write values of virtual storage devices running via a Hyper-V host server.
PRTG is compatible with multiple devices, including desktops, laptops, smartphones, and tablets. The mobile applications are intuitive, highly functional, and dynamic, making it a great tool for administrators who tend to work on the go.
PRTG is what you make of it: you can choose as many or as few sensors as you want, and the first 100 sensors are free. This means you could create an advanced, business-grade solution to prioritize Hyper-V server monitoring, without having to spend a single dollar. The solution could be extended to include other network monitoring capabilities over time, making this a highly scalable program.
You can download a free 30-day trial of PRTG.
LogicMonitor
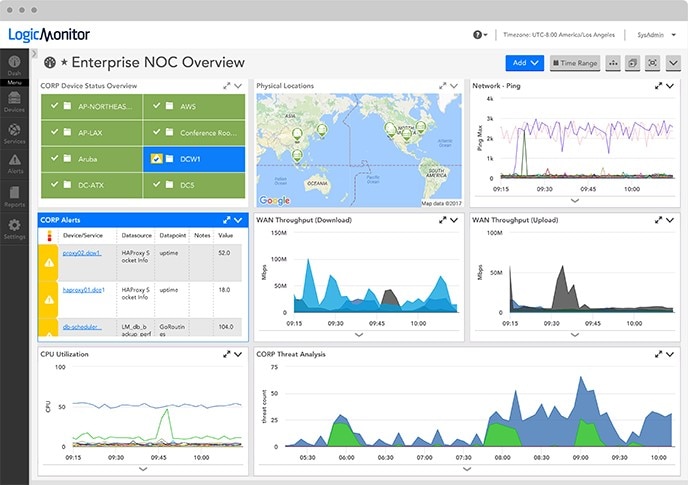
LogicMonitor is another fantastic Hyper-V tool. It offers more integrations than any other program, allowing you to integrate all the technologies, services, and devices your business depends on.
With more than 2,000 integrations, it’s no surprise Hyper-V is among them. This tool is easy to configure, with automatic discovery of all Hyper-V virtual machines in your environment. The process for getting started with LogicMonitor is easy: enter your Hyper-V server host name, and the auto-discovery process will begin.
LogicMonitor can also automatically discover hardware being used to run your Hyper-V infrastructure, which is a highly advanced utility. Once the hardware has been identified, the tool actively monitors its temperature, power supply, and fan speed. By monitoring the health of your physical hardware, LogicMonitor ensures your virtual environment is continuously and appropriately supported.
LogicMonitor monitors all key Hyper-V components, including overall health and performance, virtual storage devices, virtual network adapters, hardware health, snapshot operations, virtual switches, CPU utilization, memory usage, network throughput, and much more. You can view this data in the form of graphs and charts, which makes data interpretation faster and more accurate.
This tool gives you a high level of insight into your Hyper-V environment, but it also supports instant alerting. Alerts are triggered by predefined thresholds, which are informed by Microsoft engineering and expertise. This means performance issues and resource bottlenecks can be correlated across your infrastructure before your end users are impacted.
One of the best things about these alerts is they give advice for rectifying any issues that arise. Recommendations are explained simply, meaning you don’t have to be an expert in Hyper-V internals to implement them.
LogicMonitor can monitor Linux, Windows, databases, storage systems, and applications. A 14-day free trial is available for download here.
Best Hyper-V Monitoring Solution
On this list, SolarWinds Virtualization Manager ranks as the best Hyper-V resource monitor currently available. This tool is not only sophisticated, but also user-friendly and extremely comprehensive. It helps you rectify issues and optimize performance, without requiring you to be a virtualization expert. There is no initial learning curve, so even absolute beginners can take advantage of this program.
The dynamic and easy-to-use interface is one of the best features of VMAN. With graphical representations of data, an uncluttered aesthetic, and a centralized view of all your key data, the dashboard design is an obvious benefit of this tool.
As a scalable, enterprise-grade solution, VMAN is an excellent choice for businesses of all sizes, because it can sustain massive growth while remaining cost-effective. Having been developed by an industry-leading software vendor, this program is both dependable and well supported. SolarWinds offers technical assistance 24/7 and has a thriving community of loyal followers, accessible via the THWACK® community.
Although there are other powerful and versatile Hyper-V tools featured in this guide, SolarWinds VMAN is a specialized virtualization manager offering maximum functionality, with minimal effort.