
From single-page informational websites to multi-step transactions supporting web applications, business websites have evolved significantly. Unlike the monoliths of the past, today’s web applications are built using microservices and deployed over hybrid clouds. These applications receive much higher traffic, and their availability requirements have become more stringent. As a result, organizations now use advanced web monitoring tools to get real-time insight into their website performance and user experience through features like uptime monitoring, real user monitoring, synthetic monitoring, advanced alerting, and more. Though numerous metrics can help you keep track of websites, log monitoring can also help you resolve website issues. In this article, we’ll discuss how log monitoring can help improve website performance.
Website Log Monitoring
A log is a time-stamped, immutable record of events over time. All network devices, servers, applications, etc. produce logs, which can be organized into three categories: plain text, structured, and binary logs. Most web servers use standardized log formats and have some categorization to help you easily sift through logs. For instance, Apache servers produce separate error logs and access logs and use plain text format for storing them.
An error log gives information about a specific error with an error message. It also includes information such as the time of the error (synced to the server’s system time), log level (warn, notice, info, etc.), and the client IP address. This information is crucial for a website administrator to keep track of errors and troubleshoot them before they cause major downtime. By correlating error logs against community-sourced threat intelligence feeds, an admin can block malicious IP addresses. Similarly, access logs can provide granular information about the requests processed by the web server. If the server returns the status code 200, it usually indicates a user was able to access the webpage. By looking at the 3XX, 4XX, and 5XX status codes, administrators can assess the health of their web servers and figure out if a bug is affecting their website.
Monitoring website logs allows you to get details about every request serviced by an HTTP application and keep track of every packet entering or leaving a network interface card. Plain text log entries are easy to understand, parse, and read, and they can be queried with a simple grep command. In most cases, the tail -f command provides significant headway in troubleshooting.
However, log analysis can become challenging when log volumes grow. With organizations supporting multiple websites and thousands of visitors, monitoring individual log entries isn’t simple. Organizations need to process, index, and manage logs in persistent storage for more comprehensive analysis. Aggregating logs in one place and monitoring them with a centralized log viewer can help reduce this complexity. Here are some of the areas where centralized log management can be helpful:
- Quick detection of script errors, cron and batch jobs, failed processes and services, etc.
- Alerts for network outages and protocol failures
- Real-time awareness of network infrastructure problems
- Security and regulatory compliance
- Rich web analytics data for business decision-making
Logs vs. Metrics
Organizations also use a wide range of metrics (numbers measured and stored over time) for website monitoring. Metrics such as rate of request, error percentage, and duration to serve a request can help you keep track of a website’s health and performance. Though storing and analyzing these metrics is less resource intensive than logs, they don’t offer much help in getting to the root cause of issues. Logs also provide valuable insights with context into the long tail you can’t expect from metrics.
How to Get Started With Log Monitoring
There are many available web monitoring tools offering uptime monitoring and deep visibility into the health and performance of a website using different metrics. Log management tools can help you supplement this monitoring with logs. There are two broad categories of log management solutions:
- Open-source solutions: the Elasticsearch, Logstash, and Kibana (ELK) stack, Graylog, LOGalyze, etc.
- Commercial or paid solutions: SolarWinds® Papertrail™, Logz.io, LogDNA, Sumo Logic, etc.
You’ll need to consider your organization’s size, budget, monitoring requirements, and team expertise when evaluating and short-listing these solutions. Open-source solutions provide higher flexibility when configuring a solution, but configuring multiple tools requires significant time and effort. The overhead involved in managing open-source logging tools often distracts teams from their real work. Organizations seeking higher agility, scale, and ease of deployment as well as dedicated technical support should opt for commercial cloud-based logging or logging as a service (LaaS) offerings.
All these tools offer basic log management features. But in our evaluation, we found some tools are simple and lightweight, while others focus on elaborate security information and event management and cloud monitoring needs. Papertrail is a good choice for organizations looking for a capable and powerful log management tool. The tool can be set up within minutes and has a simple interface, allowing you to start log monitoring without challenges.
SolarWinds Papertrail
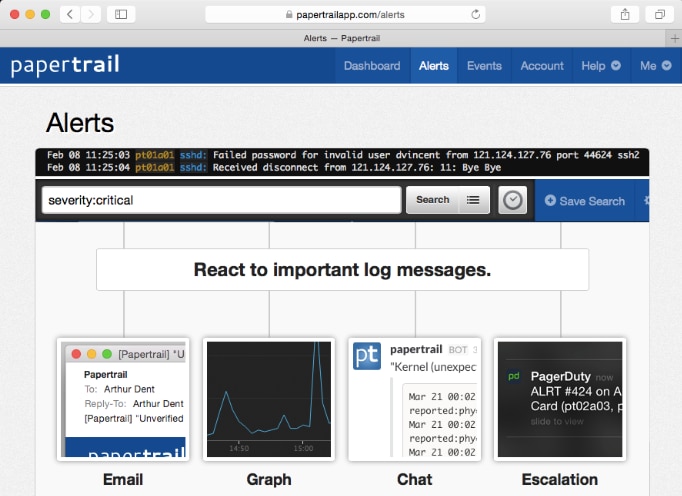
Papertrail is a cloud-based log management tool offering easy setup and quick log analysis. It can automatically parse incoming logs, and its real-time event viewer provides a stream of log messages in an infinite scroll. The different components in a log message can be color-coded for easy visibility. They’re also clickable, which helps you inspect particular fields. Additionally, you can pause the log stream or skip to a specific time to analyze events of interest. The live tail feature in Papertrail also helps you monitor logs in real time. Furthermore, when there’s an infrastructure or security-related issue affecting a website, it often leads to a dramatic variation in log volumes. There’s either a spike in log volumes or the system stops emitting them entirely. With the log velocity analytics feature in Papertrail, you can easily identify these variations and drill down to troubleshoot issues. You can also configure threshold-based alerts for proactive monitoring and issue resolution. With these and many other features, Papertrail can help make log management effortless. Learn more about the features and advantages of Papertrail here.
Conclusion
We’ve discussed how monitoring logs can help you detect and troubleshoot website issues. With log management solutions, you can enhance your monitoring and ensure higher stability and availability of your web applications. Though most commercial solutions offer advanced features you have to get used to, it’s easy to get started with Papertrail. Get a lifetime free trial of Papertrail here and switch to a higher plan when you need it.