
Thanks to garbage collection (GC), memory management in languages like Java is a nonissue. As a developer, most of the time, you don’t have to do anything. But things aren’t always perfect. The garbage collection process certainly isn’t. It’s important to keep an eye on it so you can quickly diagnose and fix issues to prevent serious performance problems. This is where a solution like Java GC log analysis comes in handy.
One of the ways you can monitor GC is through GC log analysis, which is what this post is all about. More specifically, this post is about five tools for performing Java GC log analysis. By the end, you’ll know more about not only garbage collection in Java but the tools at your disposal and how adequate each one is for your needs.
Before we get to the list itself, we’ll revisit some Java GC basics. We’ll explain what garbage collection is, why it’s important, and how GC log analysis can help you detect and troubleshoot Java memory problems.
Java GC Log Analysis Fundamentals
Before we walk through our list of Java GC log analysis tools, it makes sense to start with some basics. We’ll do this in three stages. First, we’ll define the concept of garbage collection. Then, we’ll explain what the GC log is and why it’s useful. Finally, we’ll get to GC log analysis, why you should perform it, and why you need specialized tools.
Defining Java Garbage Collection
To understand what garbage collection is, we need to take a step back and understand what life looked like without it.
In many programming languages—C and C++ are the classic examples—programmers were required to carefully keep track of used memory. When a data structure or object became obsolete, it was the developer’s responsibility to erase the object/structure and reclaim the memory it used. The process of manually managing memory was time-consuming and error-prone. Unsurprisingly, this led to bugs when developers failed to properly clear obsolete objects.
In Java and other modern languages, you don’t need to worry about this, since the process of managing the memory and removing obsolete objects is done automatically for you by a component called the garbage collector. The garbage collector works by detecting unreachable objects in memory and then removing them to claim their memory back. Garbage collectors can work in various ways, employing approaches such as mark-and-sweep or reference counting. Since the process of collection is costly, many languages use a generational approach: they organize the objects in memory in layers (or generations) according to their age. The idea is that younger objects are more likely to have fewer references pointing to them since they haven’t been around for long, so they’re equally more likely to be unreachable. By adopting a generational approach, a garbage collector can avoid examining objects not likely to be unreachable, thus saving processing power.
What Is the GC Log?
The GC log is exactly what its name suggests: a log file created by the garbage collection process. This log contains valuable information about how the GC process works and how many resources it utilizes. By analyzing this log, you can identify potential performance problems to improve the overall performance of the application.
Why Should You Care About GC Logs?
Simply put, application performance tuning is immensely complicated. You can and should employ different approaches to solve this problem, but at the end of the day, GC logs offer a unique view into the depths of Java-based applications. Since the garbage collection process needs to search through memory to identify and remove obsolete objects, it gets to see everything firsthand. Thus, GC logs are in a privileged position when it comes to being able to identify potential performance bottlenecks and other problems.
Unfortunately, GC logs can be verbose. Trying to analyze them manually is impractical, which is why a GC log analyzer tool is helpful.
Java GC Log Analysis: 5 Tools Worth Checking Out
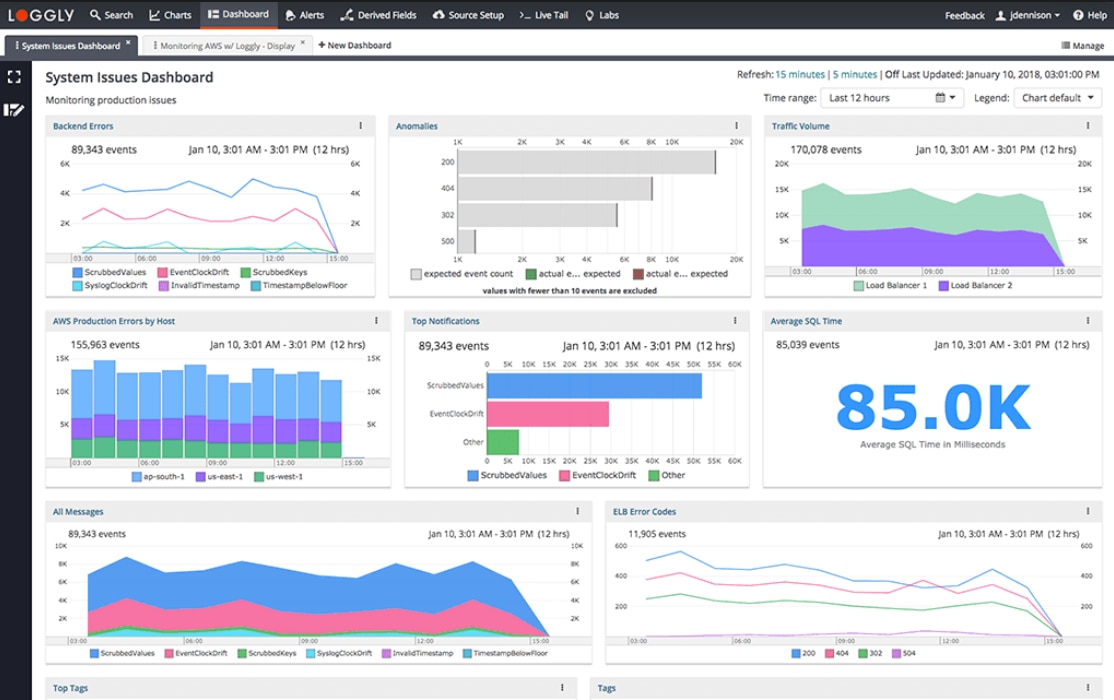
The first item on our list is SolarWinds® Loggly®.
Loggly allows you to automate GC log analysis so you can analyze GC log metrics in real time, which helps you save time. Additionally, Loggly helps you detect anomalies in your log using the Lucene query syntax.
Finally, Loggly comes out of the box with real-time alerts. You can use custom criteria to configure these alerts so they behave in a way better suited to your application’s needs.
You can give Loggly a try using this link.
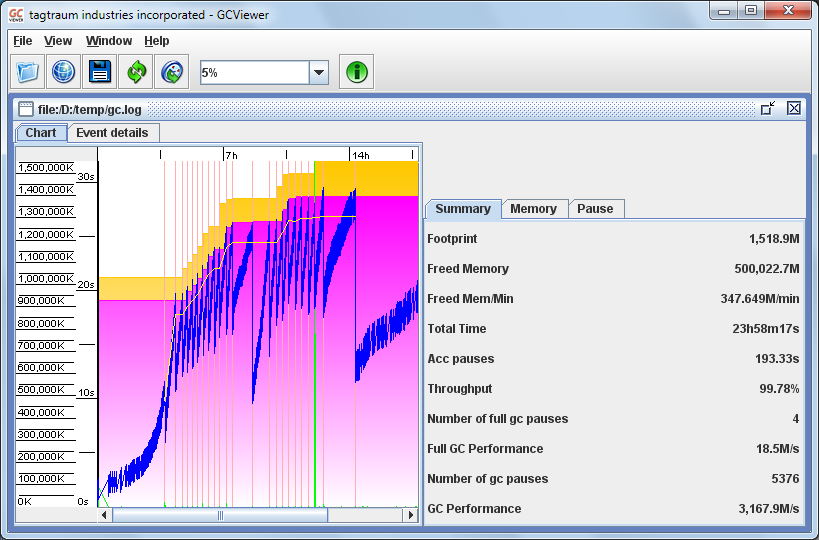
GCViewer is a tool for visualizing log output generated by the Java Virtual Machine (JVM). It’s a free software released under the GNU LGPL license.
GCViewer is probably the oldest tool on this list. It was originally released by tagtraum industries, but it stopped development in 2008. The current version is a fork from the original project.

GCeasy claims to be “a universal GC log analyzer.” The tool uses machine learning to detect anomalies in JVM and Android GC logs and recommend solutions. The tool also offers a REST API, so developers can analyze GC logs programmatically.
Finally, GCeasy offers universal log visualization tools capable of analyzing GC logs of many different formats.
Garbage Collection Memory Visualizer (GCMV) is a tool from IBM designed to help you analyze Java memory usage by parsing GC logs.
GCMV helps you check for memory leaks and size the Java heap memory. It can also pick the best garbage collection policy, among other features.

GCPlot is a free, open-source, all-in-one JVM GC log analyzer. It offers real-time GC log visualization without compromising on speed and accuracy. It offers powerful and fast visualization capabilities and end-to-end SSL encryption to ensure secure traffic.
You can run GCPlot in a Docker container, which makes it accessible to virtually all platforms. You can also have it installed privately.
Java GC Log Analysis Tools Reduce Errors in Memory Management
In a language like Java, garbage collection is an essential feature. Thanks to GC, developers don’t have to deal with the messy and error-prone world of manual memory management. It may even seem like a perfect solution. No longer chained to this thankless ordeal, developers might feel free to run toward the pearly gates of software development heaven and enjoy the eternal bliss of automatic memory management.
But GC isn’t perfect, so it makes sense to monitor the Java GC log. The Java GC log is a good way to keep track of the garage collector’s behavior. Doing so helps you quickly identify and fix bottlenecks potentially degrading the performance of your application. There’s nothing to stop you from attempting to analyze the GC log manually, but the best course of action is using a specialized tool.
Now we’ve explained GC log analysis and why you should perform it. We’ve even walked you through some of the tools you might use to perform it. Hopefully, you now understand why GC log analysis is essential and which tools are available to help.
This post was written by Carlos Schults. Carlos is a .NET software developer with experience in both desktop and web development, and he’s now trying his hand at mobile. He has a passion for writing clean and concise code, and he’s interested in practices designed to help you improve app health, such as code review, automated testing, and continuous build.