

Systems management is a crucial part of any SysAdmin’s role. A successful systems management solution will streamline your IT processes, making every component involved work more effectively and economically, at both an individual and a collective level.
As IT systems become more complicated, the demand for systems management solutions is growing, which means there are a lot of IT management software systems to choose from. In putting together this guide to the best system management software on the market today, I’ve taken into account each of the tool’s merits and any major drawbacks, with consideration of general user-friendliness, the range of functionalities included, the quality of the system’s performance, and their value.
What Is Systems Management?
Why Do I Need IT Management Software?
Best IT Management Software
Best System Management Tool: SolarWinds SAM
What Is Systems Management?
“Systems management” is a broad umbrella term for several functions contributing to the way a system runs. Some organizations include network management within their definition of systems management, while others use the term to refer to the whole IT organization or department. Alternatively, some administrators might only use the term in reference to the management of a data center.
These are some of the key functions of a systems management approach:
- Distribution of software
- Software upgrades
- Management of user profiles
- Version control
- Recovery and backup
- Printer spooling
- Job scheduling
- Protection against viruses
- Performance planning
- Logs
- Automation
- Help and service desk management
- Data center infrastructure management
- Application life-cycle management
- Networking
- System administration
- Capacity planning
Systems management encompasses the management and maintenance of how different parts of a business interact and coordinate within the IT environment. The goal of this collaboration is to achieve certain organizational objectives, to deliver high-quality performance, and to prevent issues from arising unnecessarily.
Ultimately, “IT systems management” has an extremely flexible definition varying from person to person (and from organization to organization). Given that it covers so much scope, it’s of critical importance you choose the best system management software for you and your business.
Why Do I Need IT Management Software?
The benefits of implementing effective IT management software are numerous. You’re likely to see different advantages depending on the tool you choose, and how you use it. Here are some of the general benefits you can expect:
- Increase in customer satisfaction
- Increase in efficiency
- Increase in cost-efficiency
- Greater understanding of what your customer needs
- Greater understanding of the performance of your system
- Ability to take proactive measures to prevent issues from arising
- Increase in customer loyalty rates
- Increase in consistency across business processes
- Better internal communication
- Increase in collaboration between team members
- Reduction in costly errors and issues
- Improvement in growth management and scalability
- Improvement in risk management strategies
Best IT Management Software
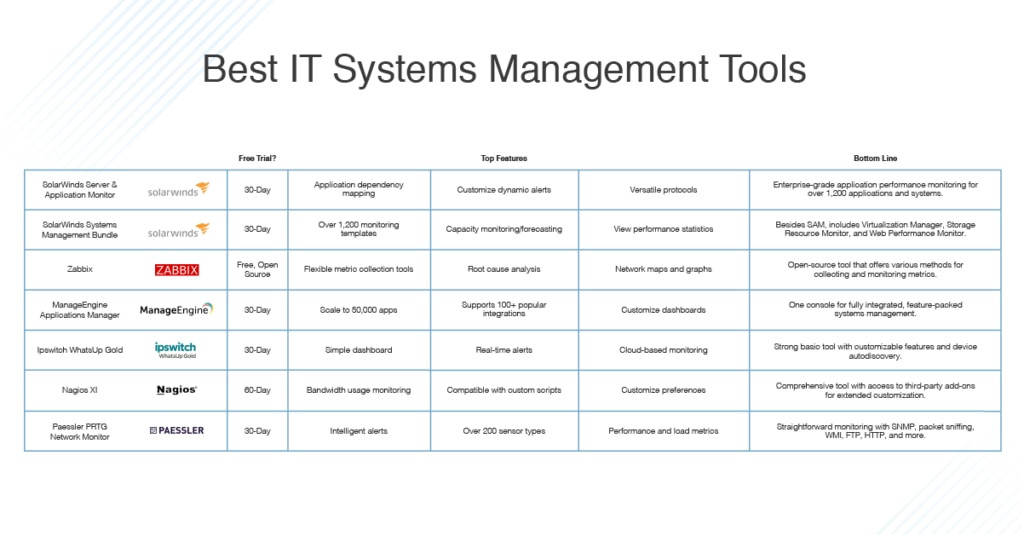
Given the way systems management is perceived and defined varies from one organization to the next, I’ve included examples of system management software covering a range of approaches to help you determine which is best for you. For those of you who don’t have time to read the entire guide, SolarWinds® Server & Application Monitor (SAM)—available both alone and as part of SolarWinds Systems Management Bundle (SMB)—is my pick for the best IT management software. It has a fantastic dashboard and an easy-to-use console, top-of-range utilities covering a wide scope of IT processes, and an intuitive design.
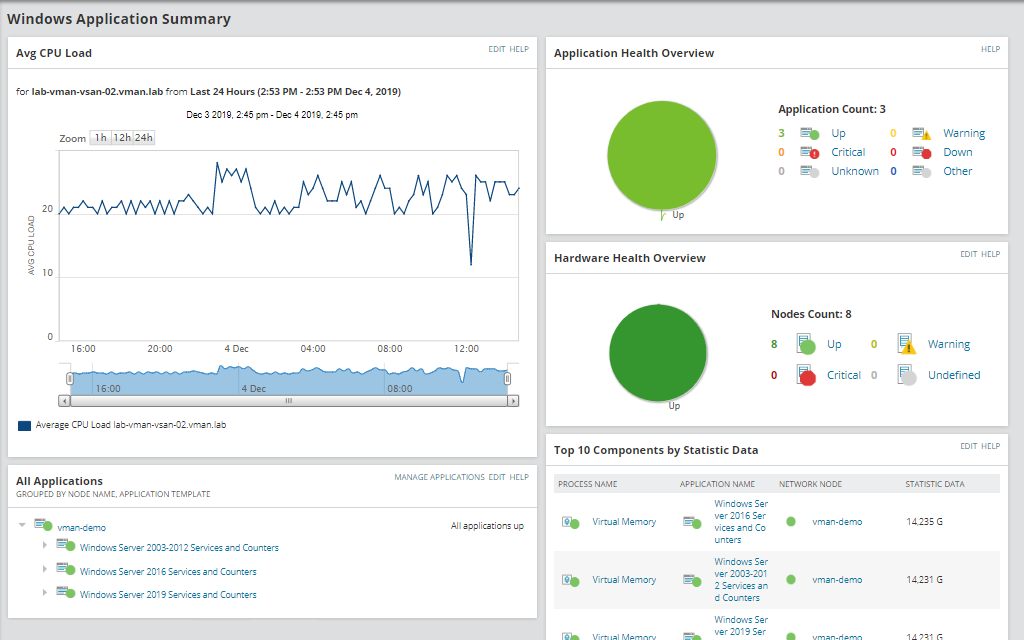
SAM offers application performance monitoring for over 1,200 applications and systems. Its functionalities include AWS cloud monitoring, Azure performance monitoring, Microsoft monitoring, Active Directory auditing, and Apache server monitoring. Out-of-the-box it can monitor GlassFish, Oracle WebLogic, Microsoft Network Policy Server, RADIUS, Microsoft Azure IaaS, Microsoft Office 365, Microsoft SharePoint, Redis, OpenLDAP, and more. The integration and support capacity of this tool is truly impressive.
SolarWinds SAM includes monitoring templates which can be utilized across your public, private, and hybrid cloud environments. You can even monitor custom applications by leveraging the built-in library of component monitors, which allow you to make your own templates. SAM enables you to monitor custom applications in the cloud, too, via a centralized dashboard giving you constant visibility into the performance of private cloud, public cloud, and on-premises applications.
SAM monitoring templates are highly versatile, letting you monitor health and performance metrics using SNMP, WMI, JMX, and VMware protocols. You can modify existing templates manually or rely on a vast range of community-build templates, which are shared on THWACK®, the SolarWinds online community. SAM also lets you run your own custom UNIX, Windows, and Linux scripts, as well as open source scripts, natively—no conversion necessary.
SAM can autodiscover and monitor AWS instances with minimal manual intervention. It can monitor EC2 cloud instances and EBS volumes as soon as you launch from your cloud account. SAM uses agentless architecture, but there’s the option of using an agent for monitoring custom and commercial apps within your public cloud environment. This gives you access to monitoring capacities you wouldn’t otherwise have with agentless technology due to network bandwidth, issues with the firewall, or security restrictions.
One of SAM’s best features, in my opinion, is its application dependency mapping tool. This lets you view incoming network connections across servers and applications, giving you a more informed understanding of which inbound connections are connected. You’ll gain insight into the incoming port, service, which server is being used, and associated internal resource consumption. You can monitor dependent service response time, see network latency levels and packet loss, and identify if it’s a network issue causing a delay.
Clearly, there is much to like about SAM, and this review is by no means exhaustive. My other favorite features include:
- Topology maps, for ease of data interpretation
- Insight into application dependencies with other IT components (like servers, storage systems, and virtualized infrastructure)
- Clever threshold-based alerts, reducing the likelihood of false positives
- Automated discovery of applications and servers, which can be scheduled
The dashboard for SAM is attractive and easy to read, and it has been designed in an intuitive way. Using the program requires little training and there’s an active community to support you if something goes wrong or if you’re unsure of how to use a particular feature.
SAM is available as standalone software, but it’s also included within SolarWinds Systems Management Bundle. As mentioned above, SolarWinds offers several products designed to address specific elements of systems management. In addition to SAM, SMB includes these tools: SolarWinds Virtualization Manager (VMAN), SolarWinds Storage Resource Monitor (SRM), and SolarWinds Web Performance Monitor (WPM).
- Virtualization Manager: VMAN was designed to fix and optimize performance issues, with an emphasis on monitoring virtual machines. It gives you full visibility across VMware and Hyper-V and insight into how your virtualization is connected to servers, storage infrastructure, and applications. This feature is available on premises, in the cloud, and in hybrid environments. VMAN lets you monitor Azure and AWS metrics, combining these with your hybrid and on-premises data in one dashboard, and will alert you according to custom thresholds.
I appreciate the VMAN console serving as the central location for executing all VM monitoring and management functionalities, because it means you don’t have to jump between tools. VM monitoring and management activities can be executed manually, or you can create your own customized alerts and scripts.
VMAN also has a VM sprawl alerts feature, which lets you reclaim virtual resources. The tool identifies opportunities to free up resources on a continuous and automatic basis, which can save you a fair bit of money and improve performance. - Storage Resource Monitor: SRM takes responsibility for reporting on the performance, health, and capacity of storage in multi-vendor environments. The dashboard is nice and simple, offering you a view of several storage devices at one time. This unified perspective can include NetApp, Nimble, Pure Storage, EMC, and INFINIDAT devices, among others. The layout of the dashboard has been cleverly designed to resemble a digital folder, which can be broken down into sub-folders.
SRM gives you a detailed understanding of RAID groups, storage array, and LUNs. This makes picking up on storage performance problems much faster. The tool also features an automatic capacity forecasting feature, which produces capacity trend reports and forecasts. Reports can be customized, or you can use the out-of-the-box, web-based reports. - Web Performance Monitor: Lastly, WPM is a simple and efficient website monitoring program helping you to identify problems before they start to affect performance. A highly scalable tool, it lets you monitor hundreds of applications across multiple locations, both within and outside your firewall. This means you can monitor critical business applications, safeguarding the productivity of your workforce.
Here’s a quick look at the key features of SMB:
- Simple installation
- Quick launch (ready to go in 30 minutes)
- Over 1,200 monitoring templates
- Built-in virtualization monitoring
- Capacity monitoring and automatic capacity forecasting
- Ability to customize monitors, modify templates, and use custom scripts
- Remote management of software and hardware across multiple workstations and environments
- Drag, drop, and overlap performance statistics
- In-depth reporting utilities
- Autodiscovery feature for apps and infrastructure
SMB is a scalable, versatile, and comprehensive IT systems management solution. Nevertheless, for some of you it may not be as cost-effective as SAM, simply because you may not need all these utilities. There is a 30-day free trial available.
SAM also offers a 30-day, fully functional free trial as well as an interactive demo.
If you’re looking at open source systems management tools, Zabbix is your best bet. This systems management software is backed, as most open source tools are, by a thriving community keen on providing new and innovative solutions. I like having a support base where I can query other users, so I appreciate this feature. Zabbix also offers a range of in-house support, both of a technical nature and in the form of consultations.
One of the things I like most about Zabbix is it offers several f metric collection methods, allowing you to collect from any system, application, or device. These metric collection methods include the following:
- Multi-platform Zabbix agent: The multi-platform, native Zabbix agent is developed in C language and runs on Linux, Windows, and UNIX. It collects CPU, disk, memory, and network interface usage data from devices. This is a great collection method because it has a small footprint and requires few resources. Zabbix agents support passive and active checks, otherwise known as polling and trapping, respectively. You can also schedule item polling for specific days and times.
- Agentless monitoring of user services: Agentless monitoring covers the network services checks (TCP port availability, TCP port response time, service checks), ICMP ping (server availability, packet loss, ICMP response time), and remote checks (SSH or Telnet commands).
- SNMP and IPMI agents: Zabbix can collect data from devices with SNMP agent versions 1, 2, or 3. These agents are present on network equipment, UPS, printers, and NAS. This essentially means any hardware connected to a network can be monitored via SNMP agents. IPMI agents are present by default on all Intel architecture—this includes servers like Dell DRAC and HP iLO. IPMI agents usually cover temperature of CPU and chassis, system voltages, fan speed, physical disk state, and maintenance LED status.
- Custom methods: Custom collection involves creating custom scripts by using the user parameter utility. You can extend Zabbix agent capabilities by customizing your own scripts in Perl, Python, Ruby, or any other executable programming language.
- Calculation and aggregation: Calculated and aggregated information is also a useful collection method. Calculated items let you create virtual data sources, where the values are regularly calculated and recalculated. The result of these ongoing recalculations are stored and made into useful graphs. They may even inform alarms. You can also create items with aggregate utilities like minimum, maximum, and average of an item in a group. For example, you could calculate the average memory usage across hosts in a group.
- End user web monitoring: End user web monitoring entails using the web module to execute predefined actions—for example, to generate a graph or send a notification. It provides information on download speed, response code, response time, and the occurrence of a string in a result. This is great for testing the integrity of a website.
Of Zabbix’s many features, these are my favorites:
- Intelligent thresholds with multiple severity levels
- Root cause analysis
- Anomaly detection
- Trend prediction
- Widget-based dashboards
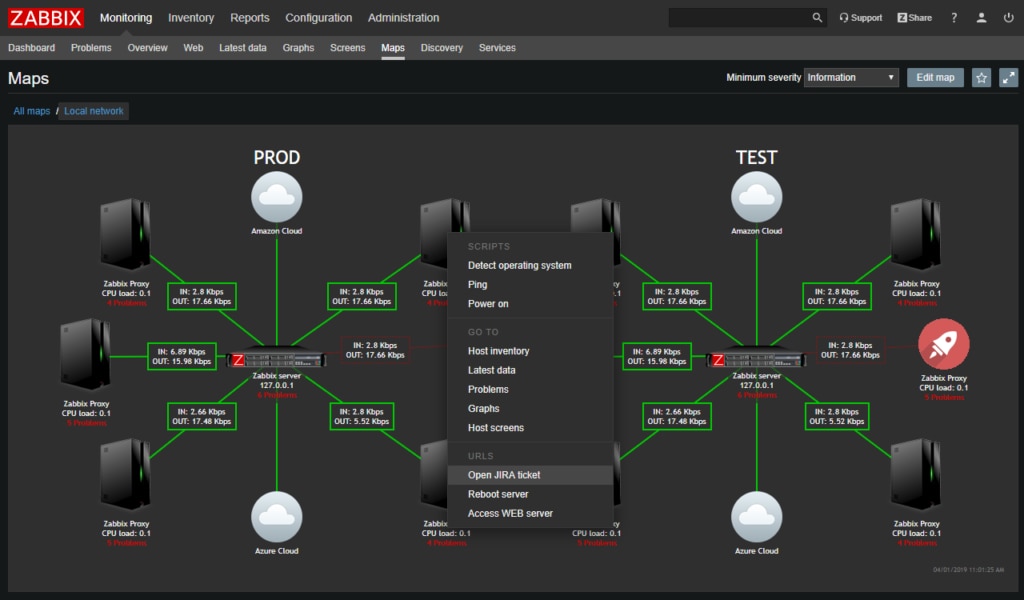
- Network maps
- Graphs
- Drill-down reports
- Automated problem-solving
- Encrypted Zabbix components
- Security audits on Zabbix code
- Flexible user permissions
Zabbix has a quick and easy setup process, offering out-of-the-box templates, so you can get started right away. Though this is an impressive tool, its open source design means it’s limited in functionality and doesn’t boast the same level of dependability as other commercial products.
ManageEngine Applications Manager is another great IT management software system packed with features. One of the primary aims of this tool is to provide you with one console for completely heterogeneous application monitoring. Applications Manager is a fully integrated performance monitoring solution for your servers and applications, covering cloud applications, virtual machines, application servers, big data stores, databases, messaging and middleware components, web services, ERP suites, and web servers.
In addition to an array of customizable features, this program offers out-of-the-box support for more than 100 popular technologies on the market. These include JDBC databases (Microsoft SQL, MySQL, Oracle, IBM Informix, IBM DB2, PostgreSQL, Sybase), big data stores (Hadoop), in-memory databases (Redis, SAP HANA, Oracle Coherence, Memcached), and NoSQL technologies (Couchbase, Apache HBase, Oracle NoSQL, Apache Cassandra, MongoDB).
Applications Manager is quite scalable, letting you monitor up to 50,000 applications with minimal requirements and resources. It has a quick and easy setup process, which means you can get started in minutes, with no training necessary. The tool keeps you informed on the health and overall performance of your database using agentless technologies. It can track lagging queries, response times, failures, a range of KPIs, page faults, and expensive statements.
Here are some of ManageEngine Applications Manager’s other key features:
- Availability in multiple languages, including German, French, Spanish, English, Korean, Chinese, Hungarian, Vietnamese, and Japanese
- Multi-user access
- Insight into your distributed network via the world map business view
- Powerful reporting utilities
- SLA management functionalities, including monitoring performance of critical applications and the availability of those applications
- Autodetection of anomalies
- Customizable dashboards
- Ability to conduct administrative activities via web browser
- Monitoring of over 100 key performance metrics
- Group applications
- REST APIs
- Autodiscovery and mapping of applications and their dependencies
Applications Manager supports Windows, Solaris, Linux, IBM AIX, HP-UX, Mac OS, and FreeBSD. Overall, this is a great tool for the application monitoring element of your systems management strategy, though it doesn’t offer the same scope and versatility of the higher-ranking system management products reviewed here.
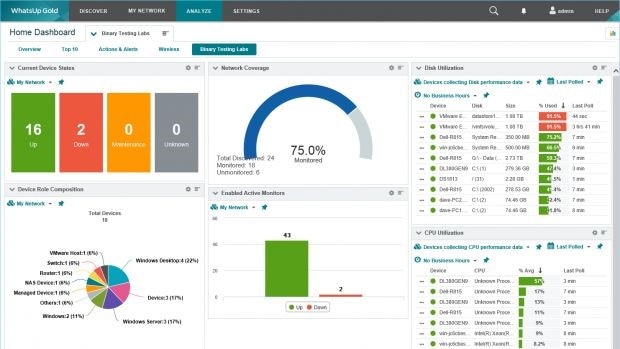
WhatsUp Gold is a network availability and performance monitoring tool offering insight into how your applications, servers, and network devices are performing, both in the cloud and in an on-premises environment. I like this program for its dynamic and easy-to-use console, which shows your data in the form of graphs, tables, and bar charts. The dashboard is simple, with three main tabs at the top (My Network, Analyze, and Settings). Within the Analyze tab, you can see how your entire networked infrastructure is faring, with interactive maps and colorful graphical representations.
WhatsUp Gold allows you to monitor devices, servers, virtual machines, wireless controllers, applications, traffic flows, and configurations in multiple environments (Windows, Java, and LAMP). Another great feature is the real-time alerts, which keep you in the loop without flooding your devices and dashboard with notifications.
Here are a few of WhatsUp Gold’s key features:
- Cloud-based device monitoring
- Autodiscovery of devices
- Automatic mapping of devices to give you a clear view of your network
- Customizable reports and dashboards
- Flexible email scheduling and distribution system
- SMTP authentication
- Customizable device roles
- Support for more than 200 Cisco MIBs, making monitoring Cisco hardware easy
WhatsUp Gold is a great tool with a well-designed dashboard. Still, it could be improved by expanding its scope of functionalities, particularly with regard to wider systems management strategies and solutions.
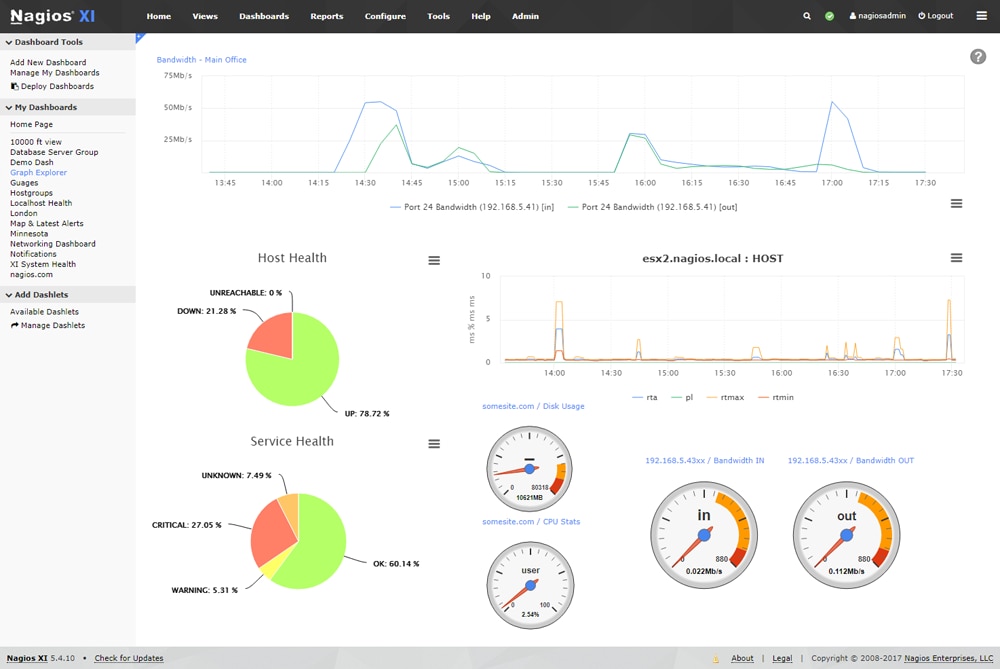
Nagios XI offers a comprehensive solution to IT infrastructure monitoring and management, covering applications, servers, operating systems, services, network applications, protocols, and more. It gives you access to hundreds of third-party add-ons, so you can make the tool exactly what you want it to be. Nagios Core 4 is the monitoring engine driving this program, and it’s quite powerful, making Nagios XI speedy, efficient, and scalable.
Getting started with Nagios XI is quick and easy. Nagios has tech operatives who are there to support you if it gets confusing, and they can even do a remote-assist deployment or quick start to make it that much faster.
I like how customizable Nagios is. The GUI lets you customize layout, design, and preferences on a user-by-user basis. This means the tool is highly flexible and can be tailored to the individual members of your team.
Here are some of the best features of Nagios XI:
- Bandwidth usage monitoring
- Real-time analytics
- Monitoring for SLAs, internet usage, uptime, IP address, and more
- Reports on individual device performance and availability
- Compatibility with distributed environments
- Compatibility with custom scripts
My only problem with this tool is the third-party add-on plugins make it less unified than all-in-one solutions which don’t require any third-party involvement.
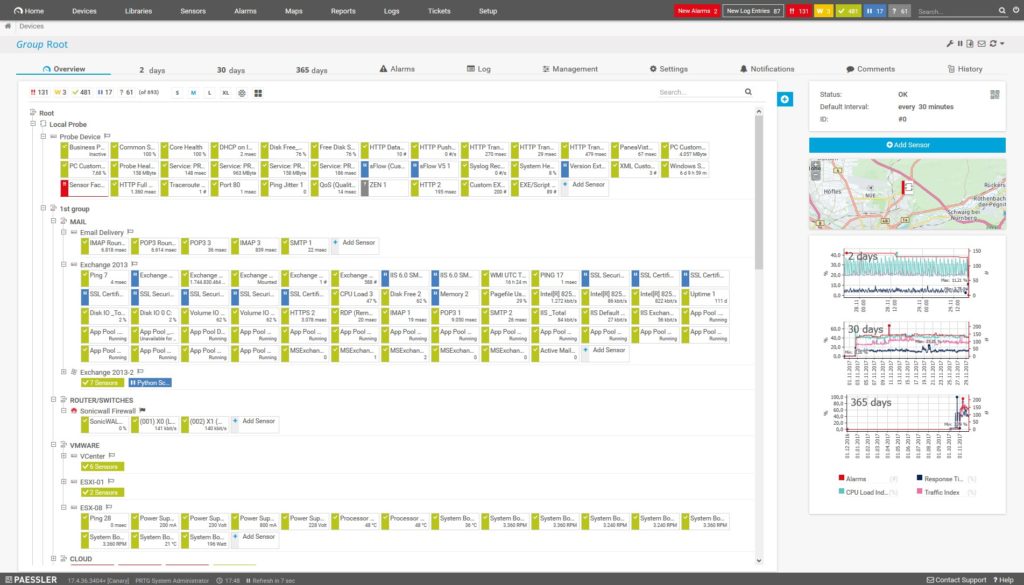
Paessler is another big name in the software development industry, and its network monitoring tool includes several useful system management utilities. PRTG Network Monitor gives you an around-the-clock monitoring system to minimize downtime and keep you updated with intelligent alerts. It’s available in English, Spanish, French, Portuguese, German, Dutch, Russian, and Simplified Chinese.
PRTG supports SNMP, packet sniffing, WMI, FTP, HTTP, and more. I like the tool’s unified approach, which brings together monitoring for network devices, servers, bandwidth, virtual environments, applications, remote systems, and IoT.
Here are some of the most beneficial features of PRTG:
- Continuous availability checks on devices
- Traffic generation monitoring by computer and application
- Monitoring of performance and load according to multiple parameters (CPU usage, network speed, RAM load, etc.)
- Comprehensive reports generated automatically
- Over 200 sensor types
- Malware attack detection
- Even distribution of load
PRTG’s alerts system is one of the best on the market. It’s flexible and versatile and comes with 10 built-in technologies supporting push notifications, email, alarm audio files, and HTTP requests. The on-premises version of PRTG also supports the execution of EXE files and the sending of text message alerts.
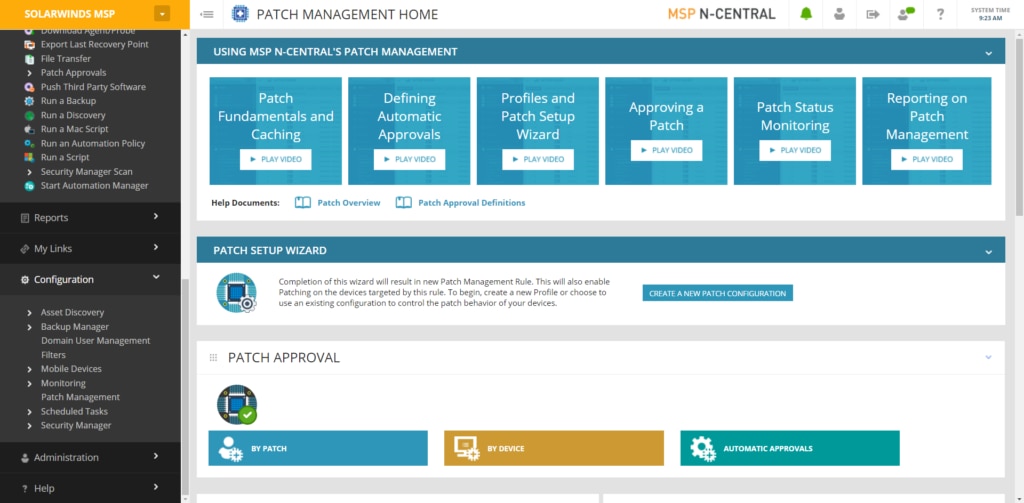
From the N-able family of products, N-central Patch Manager is designed to be a complete toolkit. While it’s a strong general-purpose solution, it’s primarily meant for managed service providers that need to take care of updates on hundreds or even thousands of client systems.
For this reason, N-central goes beyond just enabling quick update approvals and rejections. It also lets you configure automatic approval for specific types of patches. Plus, it provides tools to help users more quickly test new patches and troubleshoot problems.
Finally, it’s worth noting that this is a particularly strong option for businesses that primarily work with machines based in Windows. N-central makes it simple to deploy both Feature Updates and Monthly Security-Only updates. However, it’s not a product only for Windows and is also compatible with the Mac and Linux OSs.
Best System Management Tool: SolarWinds SAM
There are numerous examples of system management tools, suiting a range of approaches to systems management. But when it comes to comprehensive system management software, nothing beats SolarWinds Server & Application Monitor. This product has the best design out there, along with intuitive and powerful features developed to make systems management easy. SAM gives you a fully unified and centralized solution, with an attractive and colorful dashboard. It covers server and application monitoring and is built on the SolarWinds Orion® Platform, which means it is compatible and can be integrated with several other SolarWinds products. This makes it possible to create an all-in-one SolarWinds solution to perfectly suit your needs.
If you want even more scope of functionality, then SolarWinds Systems Management Bundle is a good alternative, as it combines SAM with several other robust tools—most notably SolarWinds Storage Resource Monitor, Virtualization Manager, and Web Performance Monitor. Both SAM and SolarWinds Systems Management Bundle offer fully functional free trials, allowing you to try before you buy.
SolarWinds is a well-known name among IT professionals. It has a reputation for producing dependable, intelligently designed products to suit a range of budgets. The company’s tools combine sophistication and advanced technology with simplicity and user-friendliness in a way its competitors are always trying—and more often than not failing—to match.