
It’s reported application/software downtime cost organizations $1.56 trillion in 2020. When you’re in a software/application-based business, you must be in complete control of your users’ digital experience. Furthermore, as applications become more elaborate and complex, you need to give your users the optimum experience to continue their user journeys. So how do you develop a monitoring strategy capable of enabling you to view and improve your customers’ experience with your app? From where do you access the data capable of helping you understand how your website is performing, how you can rectify slow-performing pages/screens, and why some customers choose your competitors over you?
You can address these questions with the help of an end-user monitoring tool. Such tools can help you derive more profound insights into how your apps are performing and understand exactly where your users are breaking away. All this data can help you make the required changes to ensure a seamless and optimal user experience.
End-user monitoring tools aren’t just for small and medium businesses; they can have fruitful implications for larger organizations, too. This blog explores why organizations need a compelling end-user monitoring tool and discusses the best ones available in the market today.
What Is End-User Monitoring?
When applications grow in complexity, several bugs often enter the equation and ruin the user experience. They lead to the apps frequently taking much longer to load, making the user end their journey midway. This problem needs to be tackled at the code level by the UX and development teams. They need performance insights to identify the issues, replicate the problems, and work toward a fast solution.
In such a case, end-user monitoring can prove helpful to detect bugs and concerns in real time and identify what caused them. In addition, this technology gives you a real-time picture of how users interact with your application and empowers you with information you can use to improve the user experience.
So how do they work?
End-user monitoring tools extract data directly from a user’s browser and project it on a centralized dashboard. You can analyze this data to determine the source of issues and develop the necessary resolution strategy.
Tips for Selecting the Right End-User Monitoring Tool
With a plethora of end-user monitoring tools available on the market, it’s crucial to select the one best suited for you. You have to go beyond the platforms with a “one-size-fits-all” approach and choose the one with the most benefits.
Here’s an essential checklist of things to look for while choosing an effective end-user monitoring tool:
- Visibility into comprehensive software performance
- Ability to enhance developer productivity
- Ability to track performance of high-value pages
- Higher customer acquisition at lower costs
- Customizable dashboard for viewing data
- Better stability for future releases
- Enhanced customer experience
Top Five End-User Monitoring Tools
Here is a list of the top five end-user monitoring tools:
1. SolarWinds Pingdom
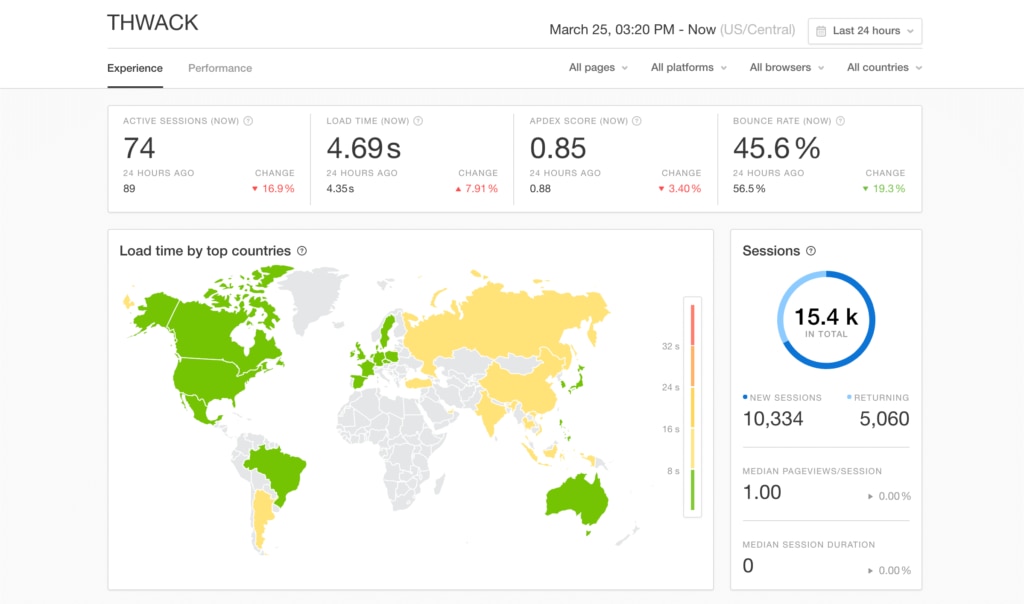
SolarWinds® Pingdom® is a specialized tool offering comprehensive and unified transaction, uptime, and real user monitoring (RUM). The Digital Experience Monitoring in Pingdom helps you garner greater insights into the regional performance of your website by applying various filters to the data with detailed reports. The tool has the intuitive ability to analyze and come up with solutions to fix issues with the help of real performance data from real visitors. It also allows you to collaborate cohesively with client-side and server-side data in a single pane of glass. Pingdom helps you deliver optimum site performance to your customers through performance reports complete with advanced visualization tools. Additionally, Pingdom integrates with SolarWinds AppOptics™ and SolarWinds Loggly® to offer proactive monitoring for application and infrastructure logs. This makes it easier to track and analyze the availability of applications and servers for end users by allowing you to efficiently monitor logs, applications, and infrastructure.
2. New Relic Browser
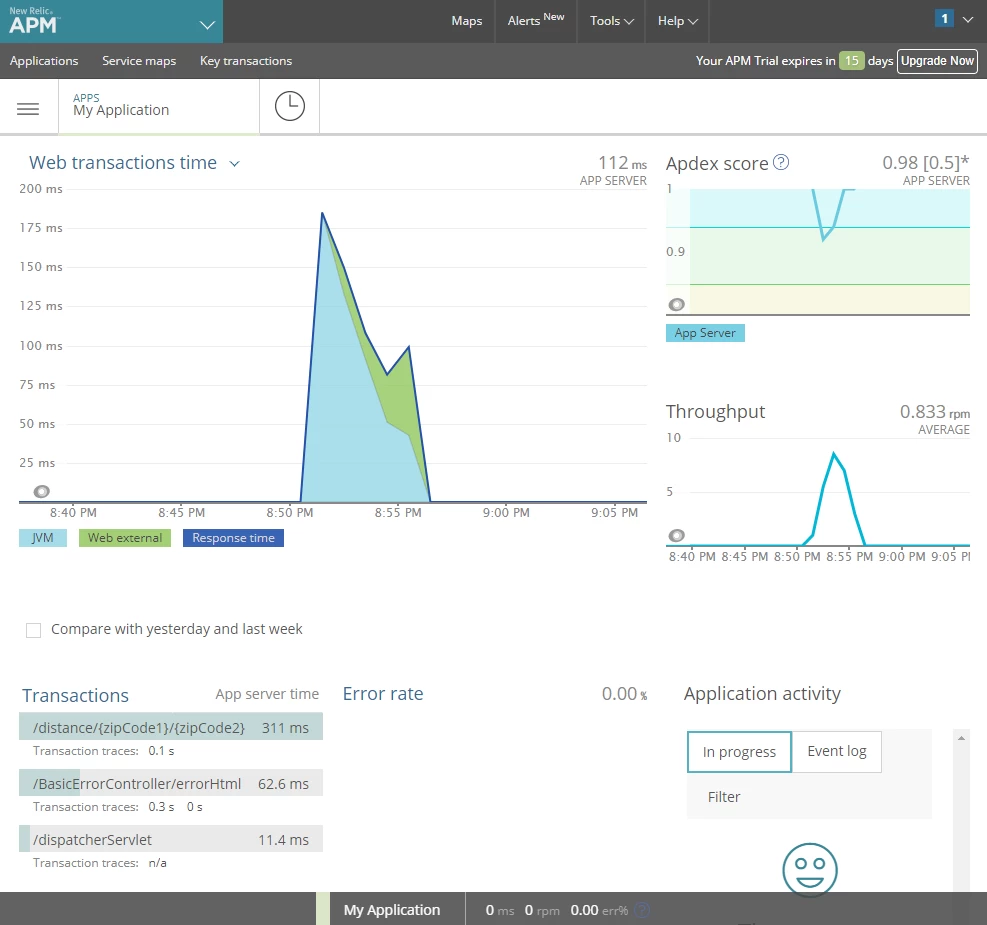
New Relic is arguably one of the most commonly used end-user monitoring tools. You can get insights from your users’ perspective by focusing on browser performance with New Relic Browser. It enables you to monitor a page’s entire life cycle or view from when a user enters the app up until they disconnect. Other features include visibility of browser page views and page load times. Additionally, New Relic Browser offers filterable geography analytics, route changes in apps with single-page application architecture, and individual session performance. The most significant benefit of New Relic Browser is it gives an option for synthetic monitoring. However, most features are available with PRO (paid) accounts only, and reports may seem less comprehensive.
3. SmartBear
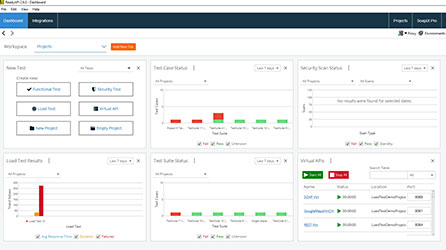
With SmartBear, you can get up to 16 commercial products with complete visibility into API readiness, software testing, monitoring, code collaboration, and code optimization, including two open-source offerings, SoapUI and Swagger. In addition, the SmartBear RUM solution—AlertSite—enables you to monitor for availability, performance, and functionality for every user’s transaction of your website or application. SmartBear is a robust monitoring tool designed to monitor web performance, API workflows, and application performance in hybrid environments with real-time alerts. However, SmartBear has limited handling capacity, a few RUM limitations, and a prolonged load time.
4. Atatus
Atatus is a performance management and error tracking platform with RUM capabilities. It gives deep insights into how your users are interacting with your applications and whether they’re experiencing any issues in their user journey. It offers integration support through a detailed stack trace with real-time alerts. Atatus also has an easy-to-set-up reporting mechanism, and it includes a customized dashboard with daily email summaries. Unfortunately, Atatus falls behind when it comes to some intuitive features available with the competition.
5. Monitis
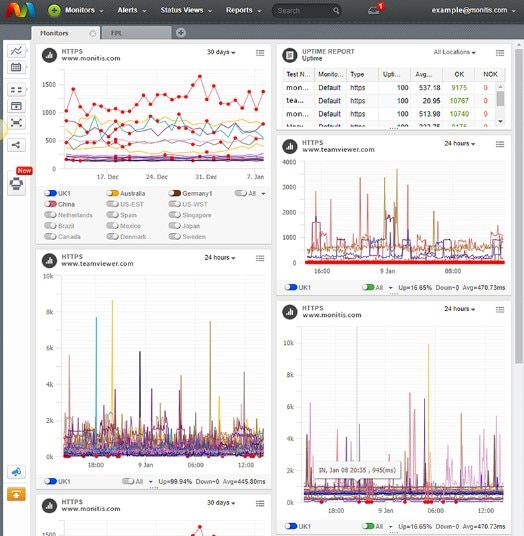
Monitis is an ideal web monitoring platform designed to help you monitor website, network, server, and application performance in one unified place. It delivers real performance insights from real users, and these insights give you an overall view of your apps’ health and make it easy to identify issues. Its cloud-based interface provides event-based notifications and real-time monitoring through mobile alerts. However, the setup may be tricky and time-consuming for some.
Keep Your Customers Coming Back With an Effective User Experience Monitoring Tool
When you create powerful applications, you want them to deliver the right experience to your customers. There’s no point in designing elaborate applications to wow customers if you end up frustrating them instead.
But there’s an easy way out of these complications. You can now quickly figure out whether your apps are working and delivering the intended experience. If not, you know exactly what needs to be fixed—this is where an end-user monitoring tool comes in handy. In addition, you can get visibility into the performance of your web applications at the code level. Even though there are plenty of options to choose from, each tool gives you insight into your website’s performance issues, such as prolonged page load speed or a bug needing to be fixed. These tools enable you to eliminate guesswork and empower you with real data-driven insights for quick bug fixes.
SolarWinds Pingdom is a comprehensive end-user monitoring tool designed to help you stay ahead with your mission-critical web applications and keep them running. It combines synthetic and real user monitoring to help you identify bottlenecks and prioritize which fixes to tackle first. It’s simple to use for a tool you can get started with easily, and it has an easy-to-manage interface capable of delivering valuable insights. Sign up for Pingdom and start your 30-day free trial.