



If your team works with SAP HANA, the main challenge usually isn’t finding another dashboard. The real difficulty is identifying which tool can quickly help you trace vague complaints about slow transactions to their root cause. In many setups, SAP HANA monitoring is divided among native SAP interfaces, cloud monitoring, infrastructure dashboards, and the broader monitoring systems used by the rest of IT. This fragmented approach can slow down root cause analysis.
Anyone evaluating SAP HANA monitoring tools should start by asking one key question: when performance drops, can the tool reveal what changed, where it changed, and what steps to take next?
| Tool | Primary angle | Standout capabilities | Best fit |
| SolarWinds® Database Performance Analyzer (DPA) | Database-centric SAP HANA performance troubleshooting | Wait-based analysis, top SQL and plan context, blocking insight, correlated resource metrics, AI Query Assist, advisor features, and support for SAP HANA 2.0+ and SAP HANA Cloud in single-container and multitenant database container (MDC) deployments | SAP Basis teams and DBAs that need deeper HANA root cause analysis with an agentless, read-only monitoring model |
| SolarWinds Observability | Full-stack observability with SAP HANA database monitoring | Built-in SAP HANA onboarding through Add Data → Databases, agent-based collection, and database performance and health views within SolarWinds Observability | Teams that want SAP HANA monitoring connected to a broader SolarWinds observability environment |
| Datadog | Broad observability with SAP HANA integration | Agent-based SAP HANA integration with metrics for memory, CPU, disk, connections, backups, network service requests, and uptime | Teams that want SAP HANA monitoring within an existing Datadog observability environment |
| Avantra | SAP operations observability and automation | Auto-deployed SAP-specific checks, hybrid landscape coverage, predictive monitoring, notifications, and workflow automation | Teams with large or complex SAP estates that want broad SAP monitoring and automation from one platform |
| IT-Conductor | SAP monitoring comparison and operations coverage | Comparison matrix across SAP and third-party tools, including SAP Cloud ALM, SAP Solution Manager, Dynatrace, AppDynamics, and Nagios XI | Teams still evaluating tool categories and deciding which monitoring model fits their SAP environment |
| Dynatrace | Broad observability and application performance monitoring | Remote SAP HANA monitoring, anomaly detection, and cross-stack visibility across applications, services, and infrastructure | Teams that want SAP HANA visibility inside a wider observability and application performance monitoring platform |
| AppDynamics | Application and database observability for SAP environments | Native SAP HANA metrics in Database Visibility, SAP-focused dashboards, and broader app-to-database correlation | Teams that want SAP HANA metrics inside a wider AppDynamics observability strategy |
| LogicMonitor | General monitoring and plugin-based visibility | SAP HANA monitoring package with availability, disk, memory, service status, active connections, and backup-related metrics | Teams that want flexible monitoring aligned with an existing infrastructure monitoring standard |
| Site24x7 | Packaged infrastructure and application monitoring with SAP HANA plugin coverage | SAP HANA plugin with availability, disk usage, host memory, service status, active connections, and backup-related metrics | Teams that want practical SAP HANA checks and alerts inside a broader monitoring platform without building every view from scratch |
| Nagios | Community plugin-based SAP HANA monitoring | Community SAP HANA checks for CPU, memory, volume usage, license status, alerts, backups, and running services, with scriptable notifications and remediation options | Teams that already run Nagios and do not mind assembling SAP HANA coverage from plugins and custom scripts |
What the best SAP HANA monitoring tools should show
First, the tool should allow you to have one view of your entire HANA environment, whether you are running HANA on-prem or HANA Cloud. A useful SAP HANA monitoring tool has to do more than tell you a database is running. It should help you track the performance metrics that affect daily operations, including CPU usage, memory pressure, disk activity, availability monitoring, active sessions, idle connections, blocking, backups, and expensive statements.
That’s the baseline.
The stronger tools go further. They add wait-based analysis, anomaly detection, reporting, notification, threshold management, and some form of process automation or recovery actions so teams can react before small issues spread into bigger business processes.
For SAP Basis teams and DBAs, that difference matters. A status panel might tell you the SAP HANA database is reachable. A deeper tool can help explain whether rising wait time is tied to a plan change, resource utilization, lock contention, or a sudden workload shift.
For companies that will have more then one type of database running in their IT environment, it is also important to have a single tool that can monitor your entire HANA database estate along with your other databases running on-prem or in the cloud.
What should you look for in an SAP HANA monitoring tool?
Start with fit, not branding.
If you run a mixed SAP landscape across on-premises systems, SAP HANA Cloud, Amazon Web Services, and other multicloud services, you need coverage that doesn’t force you to pivot across disconnected consoles every time users report a slowdown.
When evaluating your choices, consider these five factors:
- Monitoring depth: Does the solution only cover host and OS data, or can it also provide insights into SQL activity, waits, blocking, and execution context?
- Ease of setup and ongoing maintenance: How much effort is needed for initial configuration, patching, managing permissions, or tuning connectors over time?
- Alert quality: Is it possible to define meaningful thresholds and notification rules without generating excessive alert noise?
- Cloud compatibility: Does it support SAP HANA Cloud, MDC deployments, and hybrid setups?
- Troubleshooting efficiency: Can it accelerate root cause analysis when familiar workloads start to behave unexpectedly?
If your organization already uses a single platform for databases, virtualization, and broader infrastructure, maintaining consistency might be nearly as important as having deep HANA-specific capabilities. However, if your team often spends significant time diagnosing query slowdowns, deeper insights might be your priority.
Comparing different HANA monitoring tools
There isn’t one best tool for every team. Most buyers end up choosing between four broad groups.
Native SAP tools
SAP HANA Studio, SAP HANA Cockpit, SAP Solution Manager, and SAP Cloud ALM give teams direct SAP context and can be a natural starting point for SAP-first operations models. SAP Solution Manager also supports system monitoring, root cause analysis workflows, guided procedures, and SAP EarlyWatch-style operations content for HANA environments.
The trade-off is overhead. In practice, many teams describe Solution Manager as useful but heavy to configure and maintain, especially when they already have other monitoring systems in place.
SAP-focused third-party tools
For teams that want SAP-aware monitoring without relying only on native SAP tooling, three names are worth calling out: Database Performance Analyzer, Avantra, and IT-Conductor.
Database Performance Analyzer

© 2026 SolarWinds Worldwide, LLC. All rights reserved.
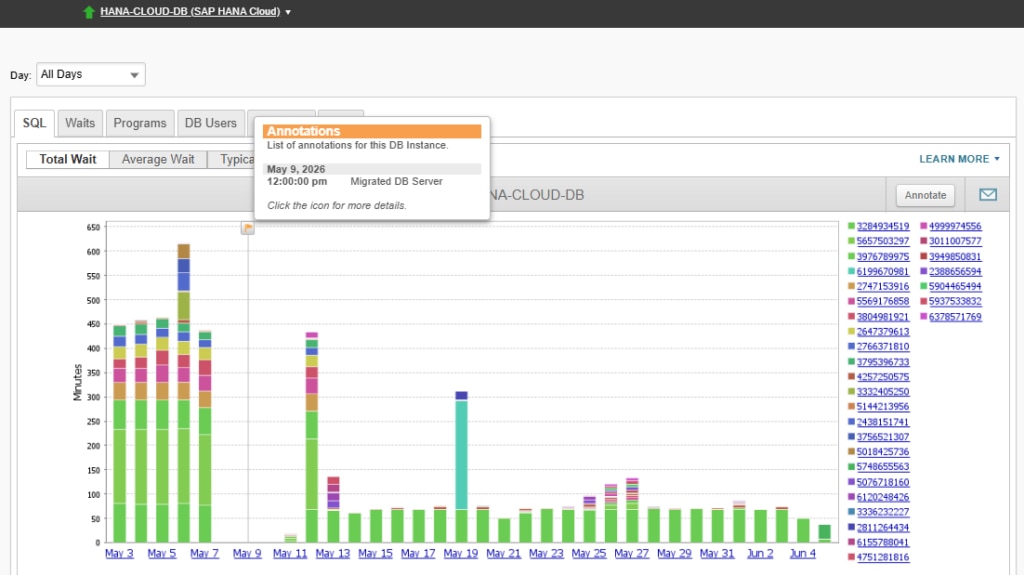
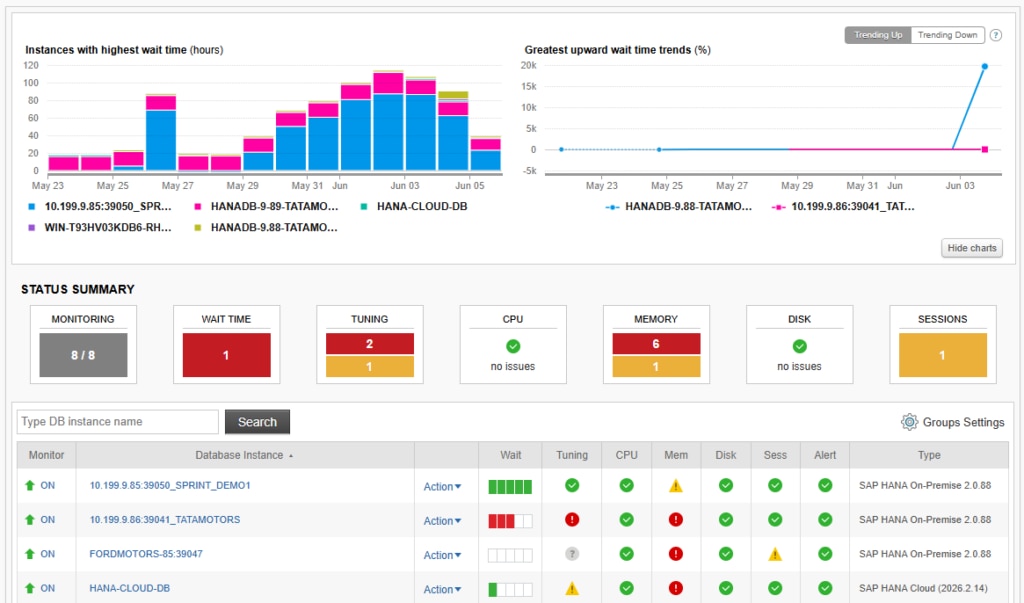
Database Performance Analyzer software focuses more tightly on the database layer. For SAP HANA, it is built around wait-based analysis, top SQL and plan context, blocking insight, resource metrics, and tuning recommendations, helping SAP Basis teams and DBAs move from symptom to root cause faster. DPA also supports SAP HANA 2.0+ and SAP HANA Cloud, including single-container and multi-container (MDC) deployments, through an agentless monitoring model that can use read-only credentials.
AI Query Assist for SAP HANA is planned for DPA 2026.4, which is currently scheduled for general availability in early November 2026.
Avantra

© 2026 Avantra. All rights reserved.
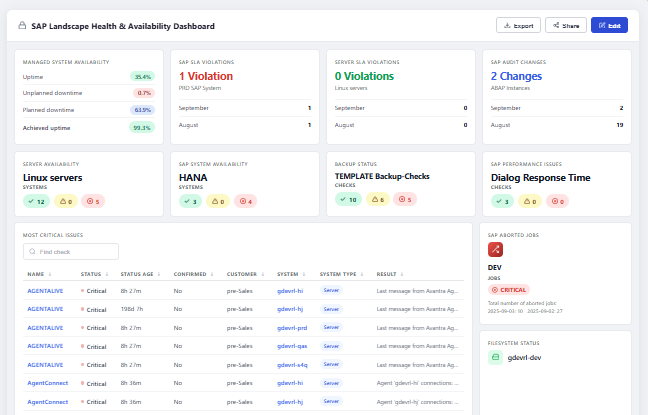
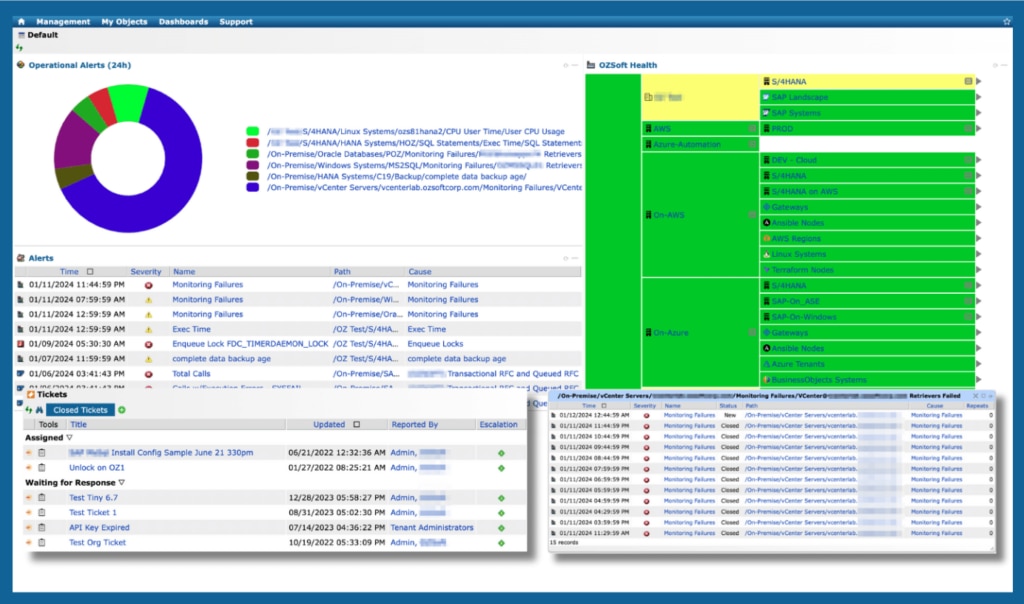
Avantra is positioned as an SAP operations observability and automation platform. Its messaging focuses on hybrid SAP landscape visibility, auto-deployed SAP-specific checks, predictive monitoring, notifications, and workflow automation for teams managing broad SAP estates across on-premises and cloud environments.
IT-Conductor

© 2026 IT-Conductor. All rights reserved.
IT-Conductor takes a broader SAP operations view, which is especially visible in its SAP monitoring tools comparison content. It frames the buying decision around side-by-side evaluation of SAP-native and third-party tools, including SAP Cloud ALM, SAP Solution Manager, Dynatrace, AppDynamics, and Nagios XI, which makes it useful for teams still comparing categories and priorities.
Broad observability and application performance monitoring platforms
Platforms such as Dynatrace, AppDynamics, SolarWinds Observability, and Datadog can be attractive when teams want SAP HANA signals alongside application, service, and infrastructure data. The products differ in monitoring depth and SAP HANA-specific troubleshooting capabilities.
SolarWinds Observability

© 2026 SolarWinds Worldwide, LLC. All rights reserved.
SolarWinds Observability takes a full-stack approach. It supports SAP HANA monitoring through the Add Data → Databases workflow, where the SolarWinds Observability Agent hosts the monitoring plugin and collects performance and health data for Database Performance Monitoring. The workflow applies to self-managed SAP HANA, including single-container and multitenant (MDC) systems, and SAP HANA Cloud. That makes it a practical fit for teams that want SAP HANA visibility alongside application and infrastructure data in a broader SolarWinds observability environment.
Datadog

© Datadog 2026
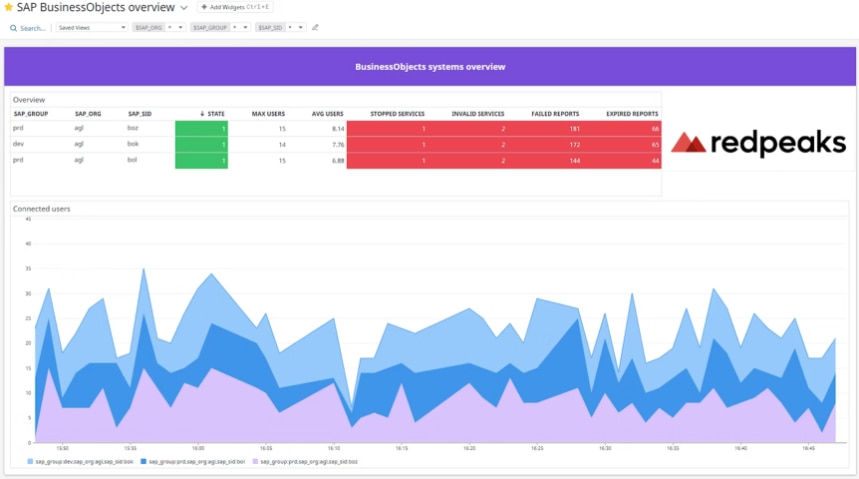
Datadog takes a broad observability approach with an Agent-based SAP HANA integration. The integration runs through the Datadog Agent and requires the hdbcli library. It collects metrics for memory, CPU, disk, connections, backups, network service requests, and uptime. It can be a good fit for teams that already use Datadog and want SAP HANA monitoring alongside their broader observability workflows.
Dynatrace

© 2026 Dynatrace LLC. All rights reserved.
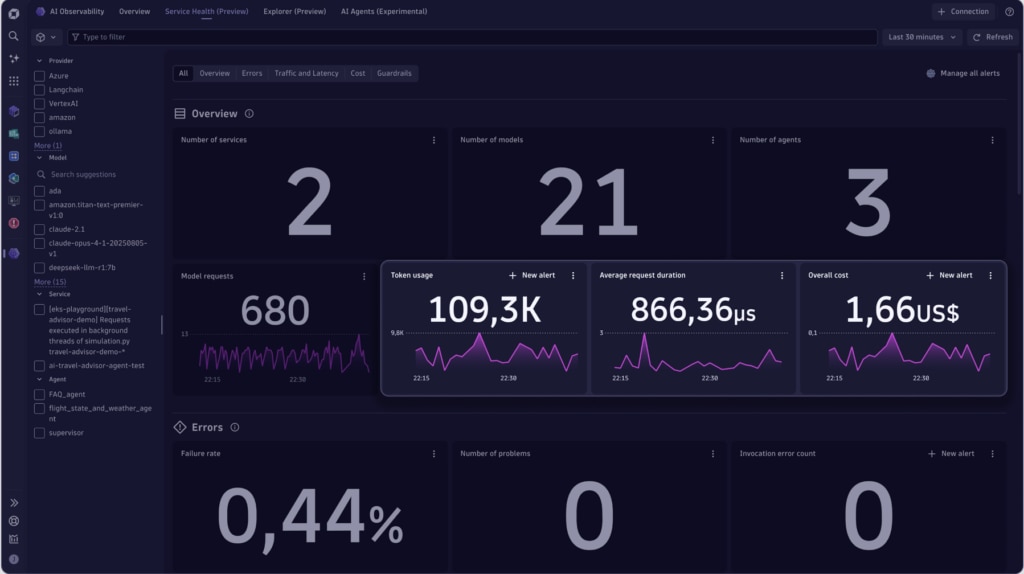
Dynatrace takes a full-stack observability approach. For SAP HANA, it uses a remote monitoring extension that pulls health and performance data, including CPU, disk, network, backup, replication, savepoints, blocking, expensive statements, and SQL plan cache metrics. That makes it a practical fit for teams that want SAP HANA signals in the same workflow as application, service, and infrastructure data.
Splunk AppDynamics

© 2005 – 2026 Splunk LLC All rights reserved.
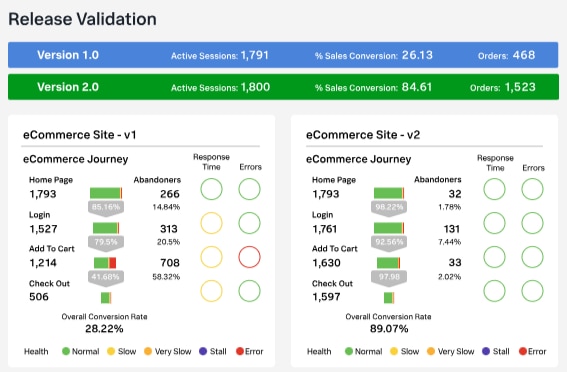
Splunk AppDynamics takes a similar cross-stack approach, but its current SAP HANA coverage is anchored in Database Visibility. It includes native SAP HANA metrics for connections, backups, CPU, memory, replication, savepoints, locks, plan cache behavior, and expensive SQL statements. That can work well for teams that already use AppDynamics and want HANA metrics tied to broader application and database monitoring.
These platforms can be a strong fit when the main goal is correlation across apps, services, and infrastructure. They may be less compelling if your top priority is deep database evidence around waits, plans, and tuning details inside the SAP HANA database itself.
General monitoring stacks and plugin-based tools
Grafana, LogicMonitor, Nagios XI, and similar frameworks appeal to teams that require flexibility, lower starting costs, or alignment with existing monitoring standards. LogicMonitor and Site24x7 both expose a wide set of SAP HANA metrics, while Grafana positions SAP HANA as part of a broader visualization and alerting model.
Grafana

© 2026 Grafana Labs. All rights reserved.
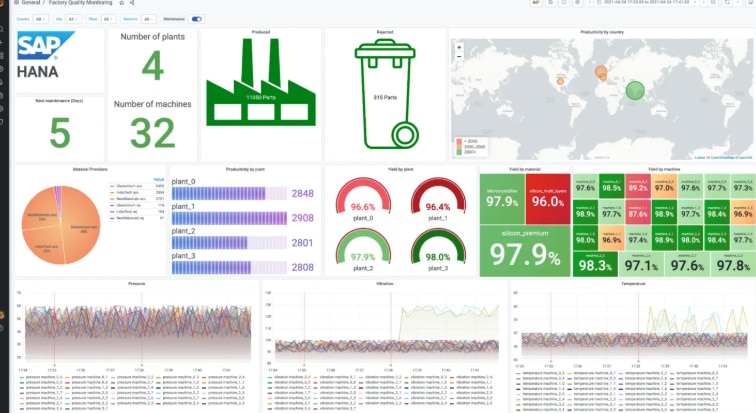
Grafana leans hardest into visualization. Its current SAP HANA integration includes prebuilt dashboards and alerts for SAP HANA metrics, and its SAP HANA data source plugin lets teams query HANA directly inside Grafana. That can work well if you already use Grafana and want SAP HANA displayed alongside your other observability data.
LogicMonitor

© 2026 LogicMonitor. All rights reserved.
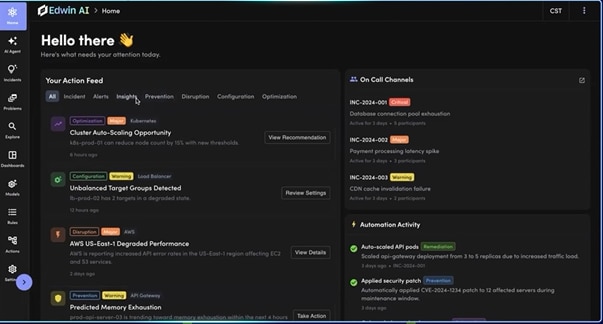
LogicMonitor is the more packaged option in this group. Its SAP HANA monitoring package uses JDBC and includes checks for database availability, disk usage, host memory, service status, active connections, backup age, and troubleshooting. This matters if your team wants SAP HANA visibility without having to build every dashboard from scratch.
Site24x7

© 2026 Zoho Corporation Pvt. Ltd. All rights reserved.
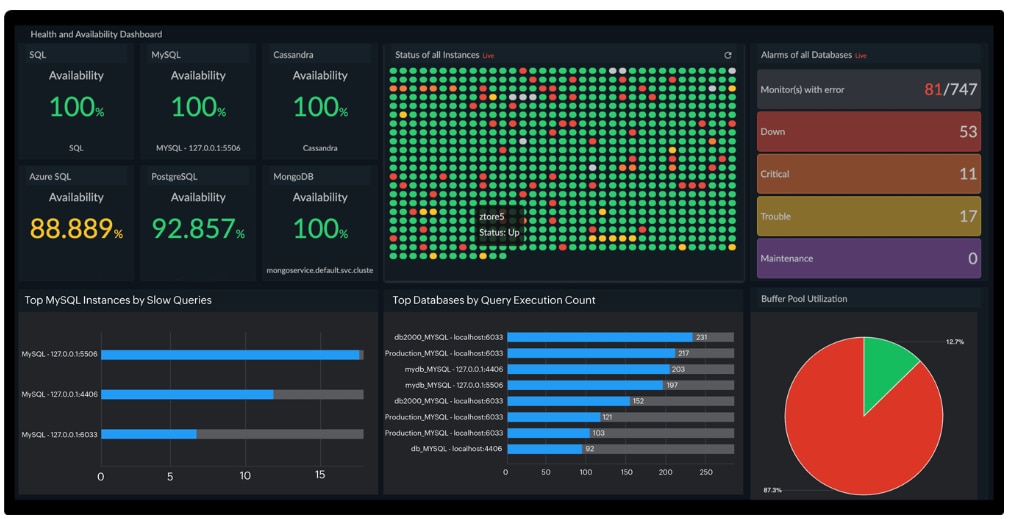
Site24x7 lands in a similar middle ground. Its current SAP HANA plugin focuses on practical health and capacity signals, including availability, disk usage, host memory, service status, active connections, and backup-related metrics. That makes it a reasonable fit for teams that want packaged checks and alerts without taking on a full custom build.
Nagios

© 2009 – 2026 Nagios Enterprises, LLC. All rights reserved.
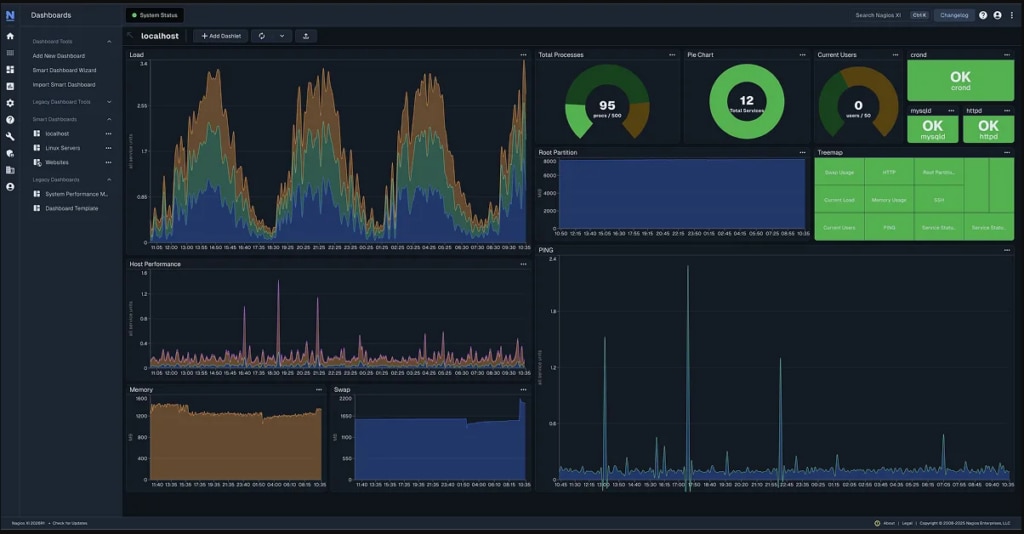
Nagios is the most assemble-it-yourself option here. The current SAP HANA coverage is still centered on Nagios Exchange and community plugins, including checks for CPU, memory, volume usage, license status, alerts, backups, and running services. That flexibility can be useful if your team already runs Nagios and is comfortable maintaining scripts, NRPE-style integrations, and custom alert logic.
The trade-off is assembly. Plugin-based monitoring can work well, but teams often need to design more of the experience themselves, from dashboards to notification flows to cross-layer troubleshooting paths.
Free vs. paid SAP HANA monitoring tools: What’s the difference?
Free and lower-cost options usually help first with visibility. Paid platforms usually help more with prioritization and action.
A free or lightweight approach can be enough if your main goal is to watch core health signals, build dashboards, and confirm whether the system is under pressure. That can be reasonable for a small team, a lab, or an environment where one or two admins are comfortable stitching together views from Grafana, exporters, or basic SAP tooling.
Paid tools tend to justify their cost when teams need faster diagnosis, broader reporting, stronger alerting, cleaner support for SAP HANA Cloud and MDC, or less hands-on maintenance. That’s usually where buyers start caring about factors such as advisor features, historical baselines, guided troubleshooting, and whether the platform can support service commitments without significant manual work.
How much do SAP HANA monitoring tools usually cost?
Pricing varies too widely across vendors to make a universal claim, but the real cost question is bigger than license price. Buyers should also look at implementation time, maintenance effort, training overhead, and whether the product reduces the number of separate tools needed for operations consistency across the SAP landscape.
That’s one reason some teams factor in Solution Manager operating overhead and use resources such as the SAP Solution Manager TCO calculator when comparing options.
How do you simplify SAP HANA monitoring?
The easiest way to simplify SAP HANA monitoring is to remove blind spots between layers.
That usually means choosing a tool that can connect SQL behavior, wait times, and resource utilization instead of forcing teams to bounce between application performance monitoring, operating system charts, cloud monitoring panels, and separate database utilities.
It also helps to choose a platform that is designed for easier rollout. Read-only credentials, agentless collection, optional SSL, and one workflow for on-premises and cloud targets can significantly reduce administrative friction.
For smaller teams, simplicity matters. If the platform can deliver real-time alerts, scheduled reporting, and one place to review service monitoring data, it will usually beat a more powerful stack that nobody has time to maintain.
Where Database Performance Analyzer fits

© 2026 SolarWinds Worldwide, LLC. All rights reserved.
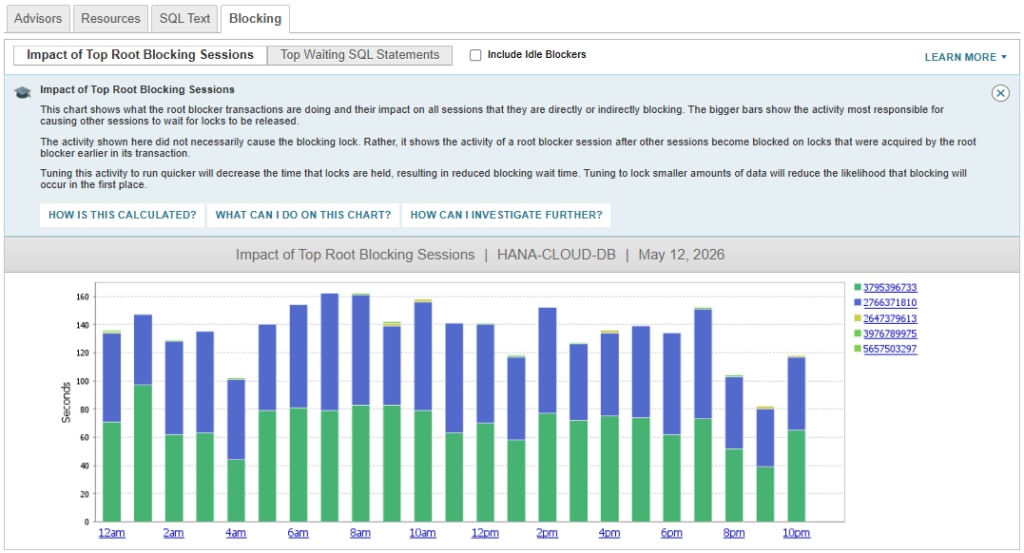
If your team wants deeper SAP HANA monitoring without piling on more moving parts, Database Performance Analyzer software is built for that middle ground. For teams standardizing more broadly, DPA can also integrate with SolarWinds Observability Self-Hosted so database wait times sit alongside infrastructure and application metrics on the same timeline. DPA uses wait-based analysis to help teams see what the database is waiting on, which SQL statements are involved, and how memory, disk, and connection trends line up on the same timeline.
That matters because many HANA problems don’t start with an obvious smoking gun. A query may look familiar, but a plan change, indexes that no longer fit the workload, partitioning choices, backup_catalog growth, or competing activity can alter how the system behaves over time. DPA is designed to give teams more evidence before they start tuning by guesswork.
DPA also supports SAP HANA Platform Edition, SAP HANA, express edition 2.0 and later, plus SAP HANA Cloud, including single-container and MDC deployments. It can register instances through a setup workflow that supports read-only monitoring users and SSL options.
FAQ
Why is my HANA database running slow all of a sudden?
Sudden slowdowns often come from a change, not a constant condition. Common examples include a query plan shift, memory pressure, blocking, unexpected workload growth, or contention from other activity sharing the same resources. That’s why a good SAP HANA monitoring tool should show both the symptom and the execution context behind it.
What metrics matter most for SAP HANA performance?
Start with wait time, CPU usage, memory consumption, disk activity, active and idle connections, blocking, expensive statements, and service availability. In many environments, those statistics can show you more than a simple uptime check because they help explain not whether SAP HANA is running but how well it’s handling current demand.