

NetFlow is a network protocol that collects information about your network’s IP traffic and monitors network traffic activity. It stands out from other network protocols for its ability to generate insights particular to application flows. Analyzing the data collected through NetFlow enables you to gain a picture of the flow and volume of traffic on your network.
What Is NetFlow?
How Does NetFlow Analysis Work?
NetFlow vs. sFlow
8 Best NetFlow Analyzer
1. SolarWinds NetFlow Traffic Analyzer
2 SolarWinds Engineer’s Toolset
3 ManageEngine NetFlow Analyzer
4 Paessler PRTG Network Monitor
DIY NetFlow Analyzer Solutions
Determining the Best NetFlow Analyzer for Your Organization
In this article, I’ll walk you through the basics of NetFlow before getting into my recommendations for the best NetFlow analyzer on the market. I review some paid software programs, while others are free or open-source.
What Is NetFlow?
Every experienced IT professional knows a comprehensive view of your network is critical. As technology rapidly advances, challenges have arisen in understanding network behavior, particularly in the areas of compliance, network security vulnerabilities, network productivity and the dispersal of resources, and application usage. In 1996, Cisco released NetFlow as a network protocol to offer insight into all these areas within a cohesive operating environment.
Used to collect information about your network IP traffic and to monitor network traffic activity, NetFlow generates insights into application flows. By implementing a high-quality network performance monitor with a NetFlow reporting tool, you can troubleshoot network issues with a high level of specificity. For larger businesses with large IT departments, the information gleaned from NetFlow analysis can be used to facilitate more accurate capacity planning and decisions about how to best allocate network resources.
Information provided by NetFlow can be leveraged to address a range of issues.
- Do you have a new application on your network? NetFlow helps you isolate what’s taking a toll on your network load.
- Are you having trouble with your network? Speed up troubleshooting and get to the bottom of poor network performance.
- Have you been seeing a reduction in wide-area network (WAN) traffic? See who or what is taking up the most bandwidth in your network.
- Have you been noticing unauthorized WAN traffic? NetFlow will pinpoint the applications causing problems, so you don’t have to spend money replacing or upgrading all your software.
- Do you have a security issue? When used in tandem with other applications like Cisco CS-Mars, NetFlow can check for anomalies and worms.
- Do you need help validating the quality of service (QoS) specifications? Keep track of your bandwidth allocation to make sure you’re not overextended.
NetFlow is in its ninth version now. If you want extra power, you can download Flexible NetFlow and IPFIX extensions.
How Does NetFlow Analysis Work?
NetFlow works by interacting with IP flows, or sequences of packets connecting a server with a destination. Each packet that makes it through the router or switch is examined for certain IP packet attributes, which are then used as packet identifiers to determine whether a packet is unique or similar enough to other packets to be grouped with them.
An IP flow is comprised of at least five IP attributes, and NetFlow uses seven:
- IP destination address
- IP source address
- Layer 3 protocol type
- Source port
- Destination port
- Class of Service
- Route or switch interface
NetFlow gathers all the data pulled from IP traffic leaving the device, inspects all the packets, and consolidates them into flows based on particular areas. Except for layer 3 protocols and router/switch interface, packets meeting all seven of the criteria above are grouped together. After their bytes and packets are tallied up, these compartmentalized flows are exported to a NetFlow collector.
Tools for NetFlow analysis incorporate three key components: exporters, collectors, and analyzers. Routers with NetFlow tools enabled create NetFlow reports, which are then processed and exported to a NetFlow collector. The NetFlow collector processes and compresses the data; the analyzer performs the necessary traffic analysis, and then breaks the analysis down into an easily digestible format. These tools can be separate pieces of hardware or they can be software-based, either paid or open-source.
NetFlow vs. sFlow
Be careful not to confuse NetFlow with sFlow. While both are concerned with packets and network traffic, NetFlow uses templates, while sFlow is a NetFlow alternative using protocol extensions rather than templates.
Going into more depth, sFlow is a packet sampling protocol specially designed to handle high-speed or high-performance networks. The “s” stands for “sampling,” but the “flow” part of the name is a bit of a misnomer—sFlow only deals with packets, not IP flows, and those packets aren’t consolidated into flows like they are in NetFlow.
SFlow can be retrofitted to snap into any network monitoring device. The sFlow exporter will take stock of all the packets going through a device and pluck out one of every n packets, where n equals the sample rate chosen in the settings. It will supplement those samples with other randomly chosen packets. SFlow takes the bytes from these samplings, transforms them into sFlow datagrams, and sends them off to the sFlow collector.
Practically speaking, there are four major differences between NetFlow and sFlow:
- Scalability. Some say NetFlow is more accurate than sFlow because it accounts for all the packets on the network instead of just a few. However, the sFlow sampling method makes it more scalable than NetFlow because it can handle large amounts of traffic more quickly. That said, the Sampled NetFlow extension can be added to NetFlow to make it more scalable.
- Performance. NetFlow uses your system’s CPU and RAM to run the flow cache, which is good for comprehensibility but not so good for performance at high volumes. Since sFlow doesn’t deal with the network device much at all, this isn’t a problem.
- Coverage. NetFlow interacts with IP only, although some layer 2 capability has been added recently. In contrast, sFlow covers layers 2 through 7.
- Latency. With NetFlow, latency can be higher than with sFlow. NetFlow analyzers conduct flow cache exports every so often based on active and inactive timeouts, and reports can be delayed due to live traffic, especially when it comes to VoIP.
If we think of network traffic as traffic on a highway, NetFlow is a wide-lens camera capturing all the lanes, whereas sFlow takes pictures of isolated vehicles as they pass. Only NetFlow will give you a clear and all-inclusive view of your data.
8 Best NetFlow Analyzer Software
When your network gets too big to isolate what’s causing problems, it’s time to start using a NetFlow analyzer. NetFlow analyzers are one of the most effective ways to get a comprehensive look at what’s going on in your network. The best NetFlow software leverages real-time and archived data to describe your network performance and keep track of all your computers, their configurations, and their performance metrics.
The following list covers what I’ve found to be the best NetFlow analyzers on the market. Expect a steep learning curve: these tools are very advanced, and implementing them can be overwhelming if you don’t have experience with NetFlow software. For this reason, you may want to consider a paid tool with access to tech support, as opposed to open-source software.
If I could only recommend one tool, it would be this one. SolarWinds® NetFlow Traffic Analyzer (NTA) provides unmatched network analysis to let you know what’s using bandwidth.
NTA can also run as a module in SolarWinds Network Performance Monitor (NPM). It’s well worth trying out both solutions, called Network Bandwidth Analyzer Pack, because these two tools are amazing together.

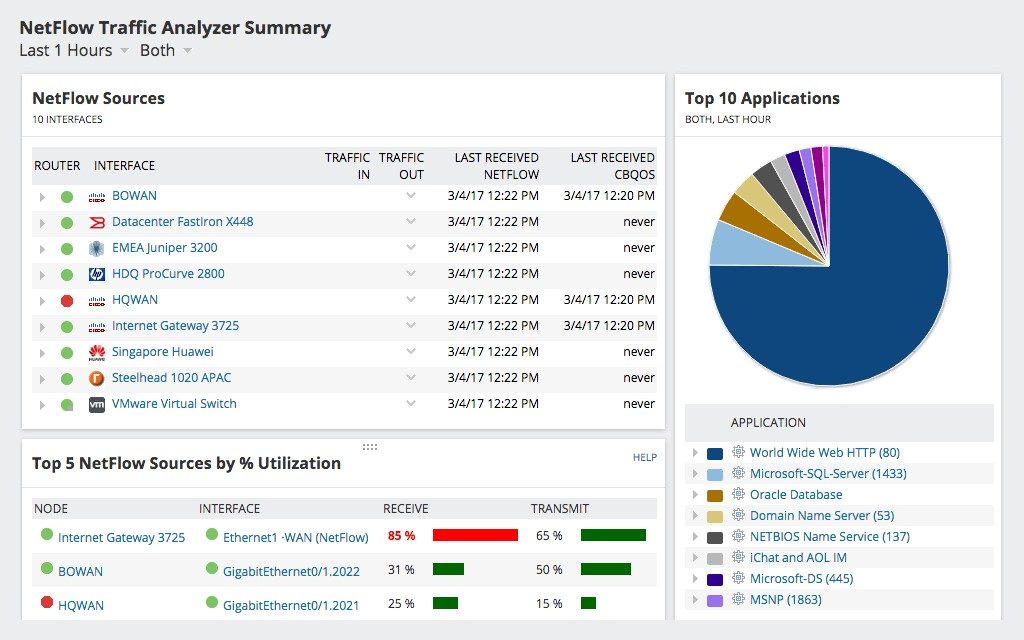
NTA works by combining flow data and Cisco Class-Based Quality of Service (CBQoS) data with the performance data gleaned from NPM. NTA then processes and breaks down the data, to be put into interactive graphs to offer a comprehensive view of your traffic history.
NTA can manage the original NetFlow program plus any variants and alternatives, including sFlow. My favorite thing about this tool is its ability to give you the information you want right out of the box. NTA breaks down traffic usage into useful categories like top 5 conversations, top 5 applications, and top 10 sources by utilization. You can also sort according to source or destination and examine traffic patterns over different lengths of time, past and present.
NTA excels in five choice areas:
- Monitoring, tracking, and analyzing bandwidth use. NTA quickly identifies the applications and users taking up most of your bandwidth and transforms the information into actionable intel. Customizable traffic reports come in handy here.
- Parsing traffic patterns. Not only will NTA collect and coordinate data down to the minute, but it also presents more nuanced options for analyzing historical traffic data.
- Capacity planning. The ability to see your bandwidth usage at a glance empowers you to make smarter decisions about how you are dividing bandwidth. Review your history to find out precisely when your network is under the most stress and work around your specifications to ease the burden. This will save you money in the long run, too, as redistributing your bandwidth means you don’t have to buy more of it.
- QoS policy optimization. If you use VoIP, a cloud server, or any other applications requiring a lot of resources, proper traffic management is critical. NTA helps to determine if your QoS settings are working as efficiently as they can.
- Performance analysis. The integrated PerfStack™ dashboard lets you visually compare traffic across stacks, making it easier to drill down on the root causes of performance issues.
You can try NTA free and fully functional for 30 days. If you are an IT manager for a medium or big company with NetFlow-enabled devices and you know you can handle all this power, SolarWinds NTA is the best NetFlow analyzer out there. It’s fast, clean, and powerful.
- SolarWinds Engineer’s Toolset (FREE TRIAL)
SolarWinds Engineer’s Toolset™ (ETS) is an excellent tool for crafting your own cohesive monitoring environment. ETS gives you the best tools available to meet all your network needs in one convenient package. It gives you access to more than 60 tools in the categories most relevant to IT administrators: NetFlow monitoring, network monitoring, auto discovery, diagnostics, configuration management, log management, IP address monitoring, SNMP, and security.
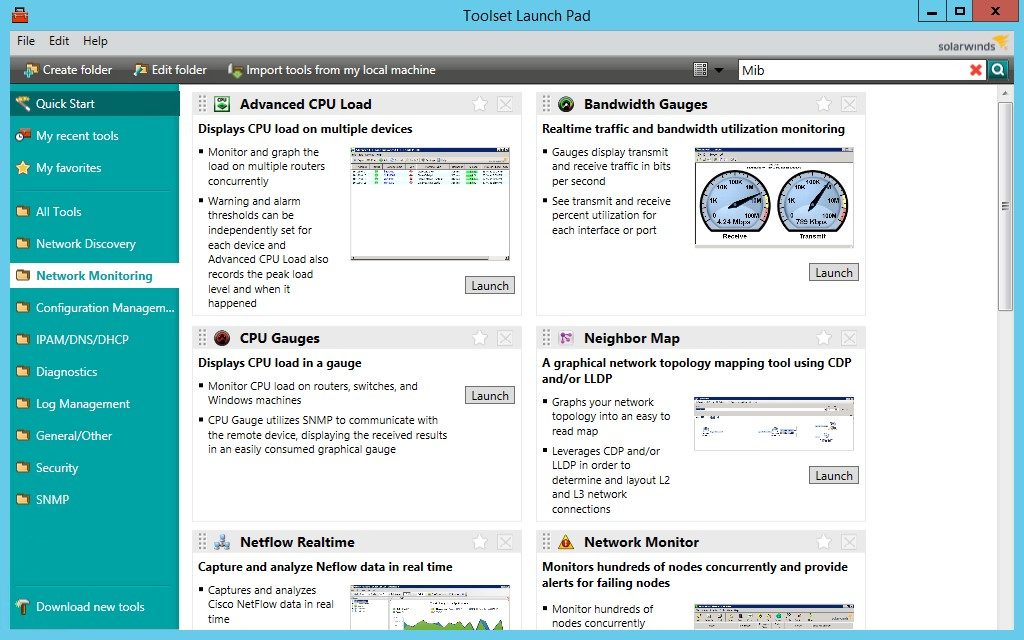
It’s overwhelming to sort through all the technology out there, but as an IT administrator or data manager, it’s important for you to stay up to date. With Engineer’s Toolset, everything can be found in one unified desktop console. From there, you can access five of the most popular monitoring tools: Traceroute, CPU Monitor, Response Time Monitor, Memory Monitor, and Interface Monitor.
In terms of tools specific to NetFlow reporting, ETS includes:
- NetFlow Real-Time Tool—Shows data in real time, so you can see the origination and destination of traffic, as well as types of traffic traveling through your network. It stores up to an hour’s worth of NetFlow data and provides separate displays for inbound traffic and outbound traffic, simplifying troubleshooting of issues related to congestion.
- NetFlow Configurator Tool—Makes it easy to configure NetFlow remotely, in addition to simplifying the setup of NetFlow collectors and implementing monitoring.
- WAN Killer Network Traffic Generator—Enables you to test your network performance by running possible traffic scenarios on your WAN. Use this information to adjust your bandwidth usage accordingly.
Engineer’s Toolset is available on a free trial basis for 14 days.
3. ManageEngine NetFlow Analyzer
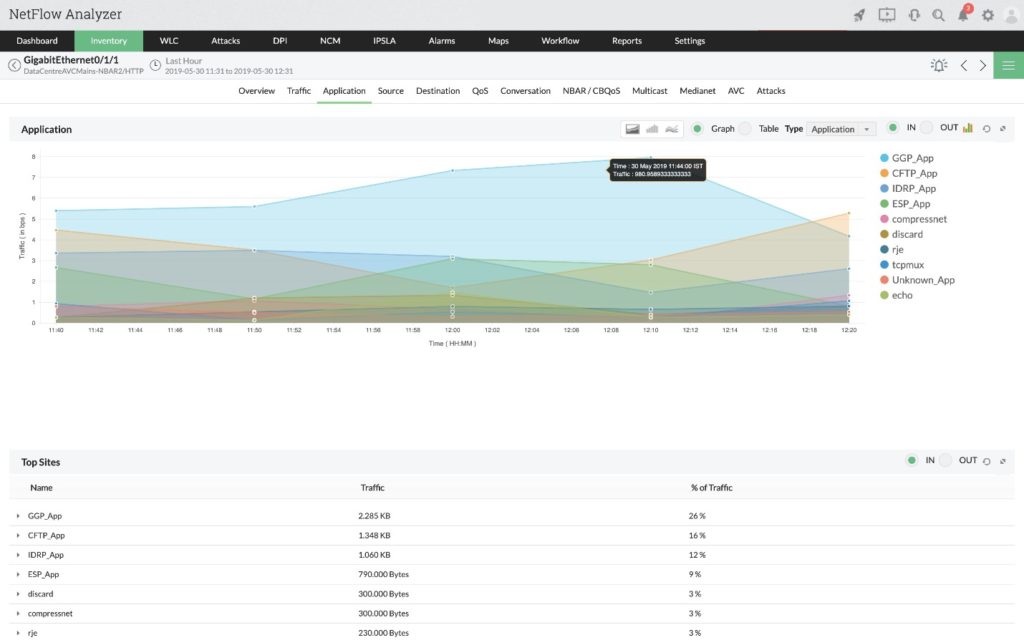
ManageEngine NetFlow Analyzer provides key visibility into traffic usage and network bandwidth hogs. In addition to NetFlow, it supports alternative technologies like IPFIX, NetStream, and J-Flow. It analyzes and filters traffic according to many of the same metrics as SolarWinds NTA, plus volume and speed, and it comes equipped with tools specifically for managing NetFlow in complex networks. Interactive graphs are available via the default dashboard embedded in the web-based user interface, including the standard pie charts, as well as heat maps to show the status of nearly everything on your network.
When it comes to reporting, NetFlow Analyzer includes a feature to compare network performance reports, either for multiple devices or for individual ones, over time. In this way, you can gain a broad overview of a quarter’s worth of traffic data, broken down to the minute. Although this may sound overwhelming, the more granular the information you have to work with, the better. These metrics help you identify peak traffic hours and see which devices cause the most problems for your network, which makes troubleshooting much easier. And if you have a big meeting coming up and need to share data with a group of people, you can export NetFlow Analyzer’s findings as a PDF file.
The tool also has specific displays devoted to uncovering security issues. Continuous Stream Mining Engine Technology will detect both internal and external security threats and track any anomalies that make it past your network’s firewall.
ManageEngine NetFlow Analyzer comes in two versions: Enterprise and Essential. The Essential version has fewer features but maybe a good choice for smaller businesses or IT departments. A free trial allows you to monitor an unlimited number of interfaces, but at the end of the 30-day trial period, you’ll be bumped down to two.
4. Paessler PRTG Network Monitor

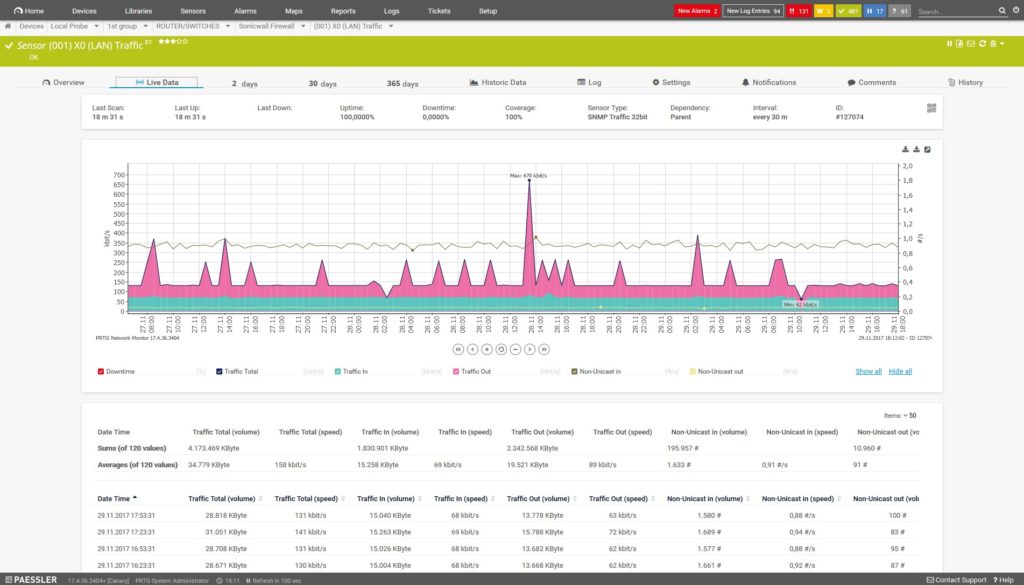
I include Paessler PRTG Network Monitor on a lot of my lists because of the comprehensive nature of its network monitoring capabilities. PRTG has several use cases, including NetFlow monitoring, and it supports all the major flow protocols and more. You can only monitor a single site using the web application. If you want to monitor multiple sites or devices, you have to use the enterprise app on Windows.
PRTG lets you monitor the health of your devices and track bandwidth usage across WAN, VPN, and cloud services on a single, unified platform. It automatically finds devices on your network and alerts you to new changes, so you can account for potential issues as soon as they arise.
PRTG is popular for its user-friendly interface. The system is simple to set up and the navigation tree is easy to manage. The device tree shows you all the devices on your network and the sensors being used to monitor each of them. In addition to your standard applications, your device tree can include routers, access points, disk usage, IoT, firewalls, workstations, servers, and more. Digging into the device tree will show you relevant indicators and metrics at every level.
Although it’s a self-contained tool and does not require the use of additional applications or software to achieve comprehensive monitoring, PRTG does have its drawbacks. Its licensing is based on sensors, which means you have to consider how many sensors your network is going to need and how much those sensors will cost you as your enterprise begins to grow. This might limit you in terms of scalability. Similarly, it uses a proprietary database instead of the more common SQL database, which can cause compatibility issues depending on how your system is set up.
The free version of PRTG Network Monitor gives you unlimited sensors for a month, but for every month thereafter you only get 100. If you’re considering the paid, sensor-based version, take advantage of the 30-day free trial.

Kentik Detect is a little different from the NetFlow analyzer tools I’ve listed so far because it works on a SaaS (software as a service) model. SaaS systems allow a third-party to host an enterprise’s applications and make those applications and services available to users over the internet. Essentially, using a SaaS system is like using the cloud. There has been a lot of debate about whether cloud services are more or less secure than on-premises systems, but that’s a conversation for another article.
When you combine Kentik Data Engine, a high-performance datastore, with Kentik Portal, a user interface, you get Kentik Detect. This tool gathers details about the different types of data passing through your system and brings them together in one unified view. You can also integrate the data into other systems. The web-based interface is customizable, and the Kentik team continually adds new dashboards, giving you a wide variety of ways to look at your data.
Kentik Detect lets you customize the alerting system to alert you only when certain conditions have been met—for example, you might opt to receive alerts when an anomaly reaches critical status, but not when an anomaly has just been detected. I can see this function being equally helpful for people who like to be alerted about every little thing and those focused on the big picture.
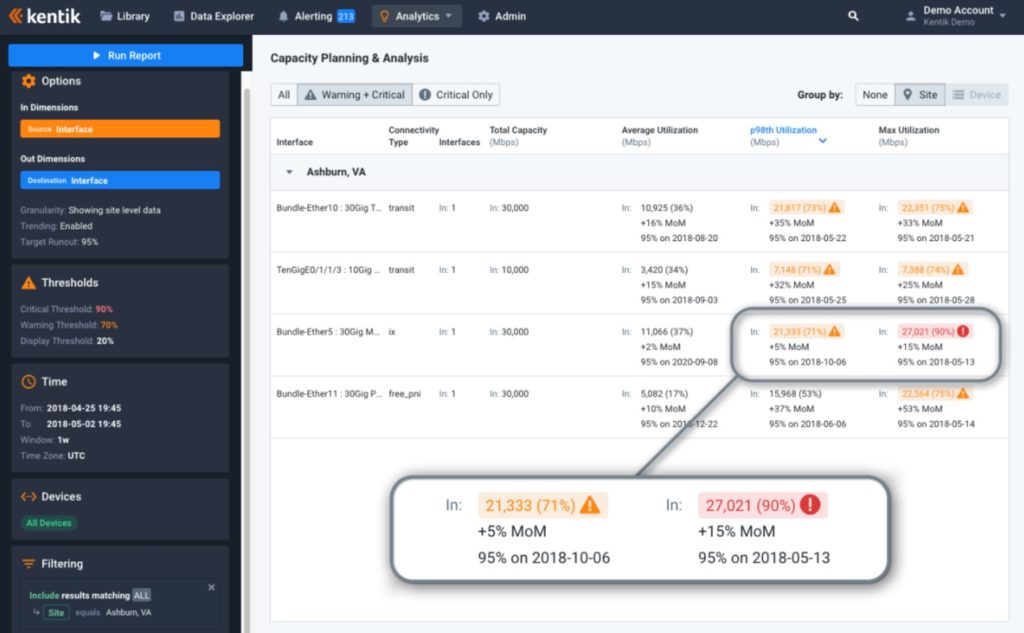
The Kentik Portal includes a function called Data Explorer, which lets you explore your network by breaking traffic data down into tables and graphs. In addition, Kentik helps you make sure your traffic delivery is conforming to service-level agreement standards, which improves the client experience and cuts down on costs.
6. Nagios

Before we move on to open-source NetFlow monitoring solutions, a word about open-source tools in general. Open-source software has exploded in popularity in recent years, for various reasons. Some people believe technology resources belong in the hands of the people and not behind a paywall, while others simply feel open-source tools are as good as the paid ones.
Since anyone can read the coding in open-source software, you can be reasonably sure there’s no malicious code waiting to jump out at you. On the other hand, since open-source tools are free, they’re maintained solely by dedicated volunteers. Because they’re not professionally managed, they can be buggy or lax when it comes to security standards. Similarly, open-source solutions tend not to have a formal tech support structure, which means you’re mostly on your own when it comes to troubleshooting, although some offer robust FAQ sections and no shortage of online message boards to pull from.
Be that as it may, when putting together lists like this one, I try to include open-source tools for those who are tech-savvy and not afraid of a challenge. When dealing with open-source, be sure to put the software through a stress test before you commit.
Now, on to Nagios Core and Nagios XI.
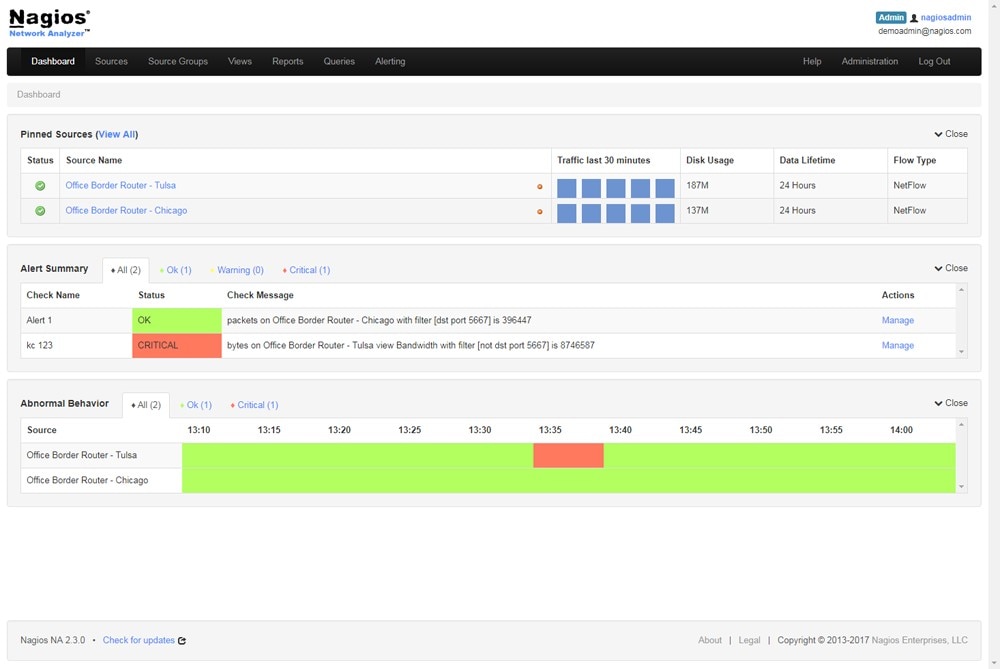
Nagios Core is the free, open-source version, and Nagios XI is the paid tool. As such, Nagios XI comes with more features and built-in tech support for configuration issues. Nagios Core can be difficult to get a handle on, though an active community of users can help you.
Nagios XI is much better for NetFlow monitoring, because it has a more advanced user interface and supports extensions for a nuanced operating experience. Capacity-planning graphs help you see how your network resources are spread out among applications, which enables smarter decision-making when it comes to triaging network needs in the future. The operations screen provides an overview of your network, while the operations center gives you detailed information. Nagios XI also summarizes the metrics being used to monitor certain hosts and displays the health status of all devices you’re monitoring.
A word of caution about Nagios: their reputation for being a reliable, powerful, and scalable network monitoring option comes with a reputation for being difficult to configure. Furthermore, Nagios Core does not have an auto-discovery function. Its advantage is the ability to customize the tools to suit your organizational needs, which can help you get the most out of the software.
Nagios XI boasts a generous free-trial period—a full 60 days. If you decide to go with Nagios Core once the trial period for Nagios XI is over, you can save your configuration files before uninstalling the software. By using those files as a jumping-off point for Nagios Core, you’ll skip a couple of steps in the configuration phase.
7. Wireshark

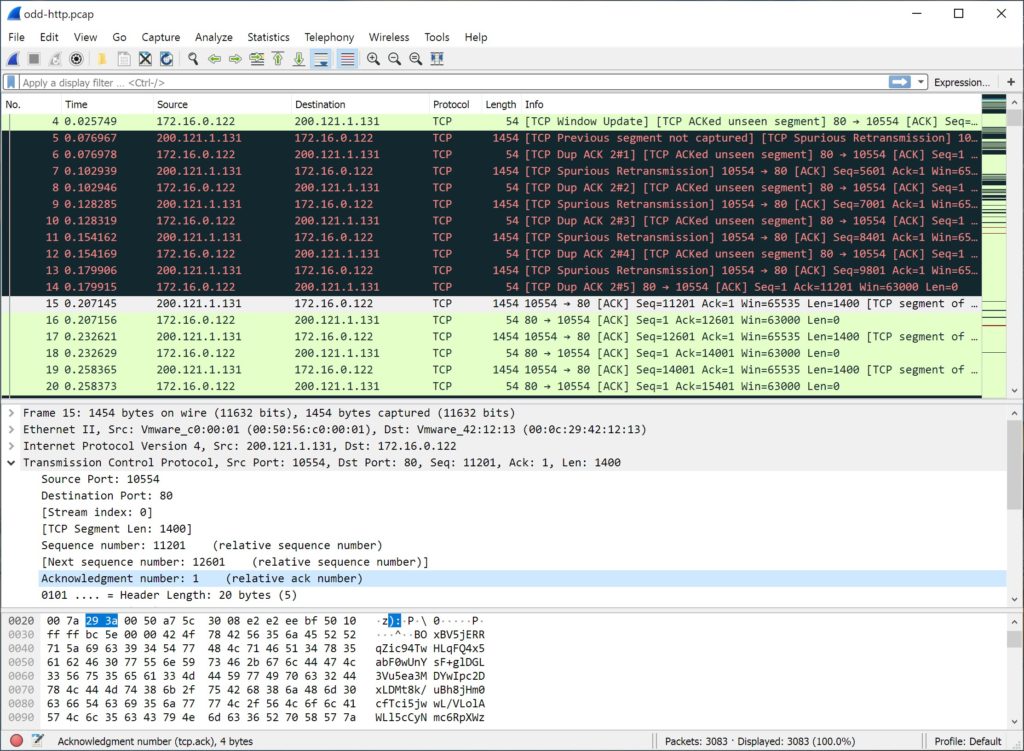
Wireshark is another free, open-source NetFlow reporting tool. Most people associate Wireshark with packet loss, but its capabilities extend to NetFlow analysis. Anyone who needs to monitor their network—from home users to network administrators in charge of large IT departments—can benefit from Wireshark’s user-friendly interface, scalability, and versatility. This product also has a tiny edge over Nagios Core since it doesn’t require a lot of extra add-ons to be functional.
Wireshark can handle even the heaviest NetFlow workloads with ease. It pulls all kinds of traffic from your network—Wi-Fi, Ethernet, Bluetooth, VLAN, WAN—and analyzes it by capturing and monitoring packets. You can do a lot with this information: for example, you can use it to figure out why packets are getting dropped or to verify network applications. You can also use Wireshark to view network statistics.
Overseeing all this traffic can be overwhelming without an effective way to break it down, which is where filters come in. Wireshark’s capture and display filters work to optimize NetFlow reporting. Capture filters enable you to block out certain traffic based on size alone, while display filters break down traffic data you’ve recorded in the past. These filters are incredibly useful when your network is taking in thousands of packets per second; sifting through NetFlow data manually in such cases would take forever and be incredibly taxing.
If you want a tool designed specifically to make troubleshooting easier, look at Wireshark. It’s free to download and fully functional out of the box.

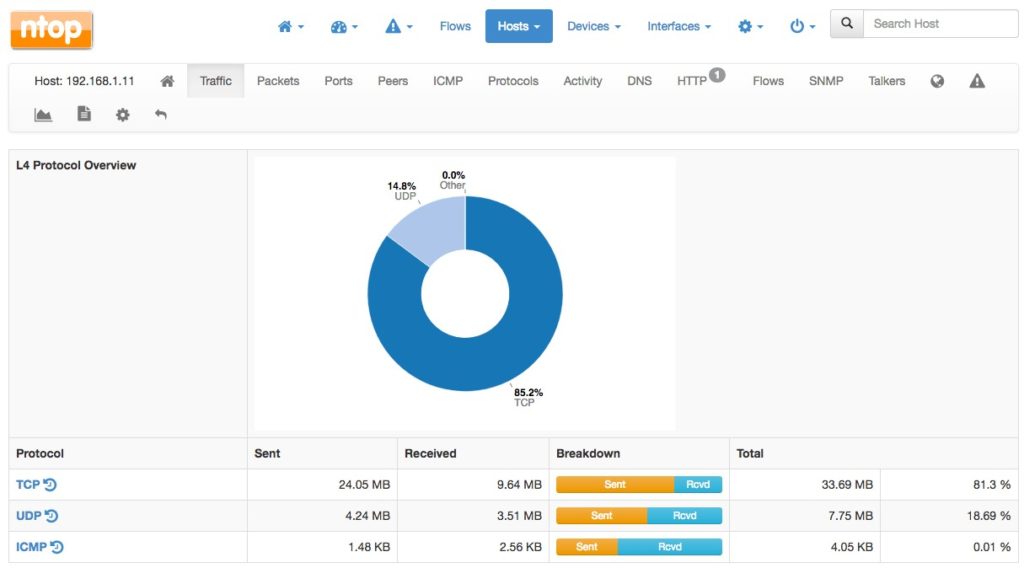
Another NetFlow monitoring open source tool, ntopng is a traffic analysis solution that captures packets to monitor flow data. To get the data, it relies on an open-source NetFlow collector called nProbe.
The web-based interface consolidates packet data into flows. Then you can sort flows according to criteria like IP address, protocol, and throughput. ntopng offers a wide variety of views, charts, and graphs to help you look at each of those flows more closely. You can even isolate IP addresses on geological maps—a feature not found in most NetFlow analyzers.
ntopng comes in three versions—Community, Professional (for small businesses), and Enterprise. Only the Community version is free. As you would expect, licensing gets more expensive as you move up the ladder, although both the Professional and Enterprise versions of ntopng are free for educational organizations or non-profits. You can test-drive nProbe for free, but your ability to use NetFlow data will be limited unless you buy the licensing for the paid version.
DIY NetFlow Analyzer Solutions
For whatever reason, sometimes pre-packaged tools can’t give you what you need. Maybe they’re not powerful enough. Maybe you’re a highly knowledgeable IT professional and think you could build something better than what’s out there, or just want to try your hand at homegrown NetFlow data analysis. Whatever the case may be, options are available for those looking to create their own solution for NetFlow monitoring and analysis.
Splunk, Elastic Stack, and Grafana are a few examples of software you can use to build a decent traffic analysis system. Splunk is a packet sniffer offering a NetFlow add-on, and Elastic Stack and Grafana are open-source toolsets capable of integration with NetFlow. The success of the do-it-yourself approach depends on the current size of your network, how complex it is, and how big you expect it to grow in the future, as well as your level of expertise—including whether you’re willing to put in the time and effort to learn.
Determining the Best NetFlow Analyzer for Your Organization
In this article I’ve presented recommendations for best NetFlow analyzer, including both paid and open source options. I’ve also touched on the DIY approach to NetFlow monitoring. The following overarching considerations should guide you in determining which approach is best for your organization:
- Network size and complexity
- Plans for network growth and expansion
- Level of expertise
Although open-source tools may be appealing for their flexibility and price point, they don’t come with the support you’ll get with premium paid software. For out-of-the-box functionality and peace of mind, my best picks are NetFlow Traffic Analyzer if you’re looking for a solution dedicated to NetFlow monitoring and Engineer’s Toolset as the best solution for those wanting to monitor NetFlow alongside other, related network metrics.