

Virtual machines, or VMs, are becoming increasingly common in enterprise infrastructures, joining physical computers, printers, and database servers on the network. Their uses include application development and testing, storage, operating system flexibility, and workspace duplication. The challenges when dealing with VMs are complex, as they can use resources in different ways than physical machines and may be exposed to different risks and performance issues. To maintain well-performing and healthy network infrastructure, IT professionals need to understand how virtual machines work, and how to work with them.
As with physical devices, the management, monitoring, and optimization of virtual machines is vital to complete with out-of-the-box VMware alerts and other features to make virtualization this path, as they can provide valuable insights and information about your physical and virtual infrastructure, including troubleshooting assistance, performance metrics, and ways to make your entire system function more effectively. Crucially, implementing a good performance monitoring tool helps ensure end users are getting what they expect from their virtual machines, without slowdowns or inefficiencies.
In this article, I’ll start with a brief explanation of what virtual machines are and how they work, and then discuss the best tools on the market today. I’ve recommended my favorite tools for different uses, looking at their relevant features, software compatibilities, and pricing. Some are most suitable in an enterprise or large infrastructure setting, while others are better for smaller and medium-sized businesses.
What Is a Virtual Machine?
What Are Virtual Machines Used For?
How Does Virtual Machine Work?
What Virtual Machine Software Is Available?
How to Set Up a Virtual Machine
Improving Virtual Machine Performance
Best VM Performance Monitoring Tools
The Takeaway on Best VM Monitor
What Is a Virtual Machine?
At its most basic level, a virtual machine is a computer system running on software rather than hardware. This software creates an “imaginary” computer that behaves like a physical one. In other words, you create a computer inside another computer. Virtual machines are known as “guests” on the primary “host” computer.
While the virtual machine is created using the software, it uses the physical resources of the host machine, such as CPU, RAM, and hard drive storage. You can set up as many virtual machines as you want on your host computer, but you will have to divide your physical hardware resources among the virtual machines. The number of virtual machines you can have at one time is only limited by your host computer’s resources; however, most virtual machines will run slower than a physical computer simply due to the extra layers of overhead they have to go through to the function.
The functions provided by virtual machines are similar to physical machines, but VMs don’t run directly on the hardware of the computer. Instead, a “hypervisor” exists between the hardware and the virtual machine. This layer in the middle both protects the host machine and creates and manages the virtual machine. I’ll go into more detail on hypervisors later.
Types of Virtual Machines
There are multiple kinds of virtual machines. They work in different ways, and each one has its specific purposes. The two main types of virtual machines are system virtual machines and process virtual machines.
- System Virtual Machines: A system virtual machine is intended to mimic an entire computer system, including the ability to run a complete operating system. System VMs are usually used to run programs on an operating system the host machine doesn’t have, or to run multiple instances of virtual machines to efficiently use hardware resources. The operating system on the system virtual machine is kept isolated from the host machine.
- Process Virtual Machines: Process virtual machines, in contrast to system virtual machines, are created expressly to run a process or application. When this process isn’t in use, neither is the virtual machine—the VM is destroyed when the process or application exits. One example of application virtualization is Wine, a piece of software that operates on Linux but runs Windows applications. Open the Windows application, and it will run through the Wine virtual machine. When you’re finished with the application, Wine also closes.
Disk Allocation: Fixed vs. Dynamic
You can allocate disk space for VMs either dynamically or in a fixed way.
- Dynamic disk: Using a dynamic disk allows the VM to expand into as much disk space as necessary (to an upper limit).
- Fixed disk: With a fixed disk, you can allocate a space to remain constant regardless of how much the VM is using. I’ll go into more detail on why you might want to choose fixed versus dynamic allocation below.
What Are Virtual Machines Used For?
There are numerous uses for virtual machines, including testing or experimenting with different operating systems, running programs your host machine can’t run, and sandboxing new applications or developments that you don’t want to affect your host machine.
- Operating system flexibility – Virtual machines can run a different operating system than the host machine. If you’re more familiar with how one particular operating system works, or if you want to use a particular development terminal (e.g., one available only in Linux), you might use a VM to this end. You may also have users who are more comfortable using a different OS, in which case a VM will help them to work more efficiently.
- Running non-native programs – A natural extension of OS flexibility is the ability to use a VM to run programs not native to your host operating system. For example, you might have a host machine running Windows but need to use a program or tool only available on Linux. You can create a virtual machine to run this other operating system—either as a process virtual machine, as in the Wine example above, or as an entirely new process-independent operating system.
- Software development and testing – Virtual machines can be used for testing in-development software, as applications can be installed on the VM and then reset to a saved state whenever needed. If you’re trying out a new application and aren’t sure how it will perform under certain conditions, you can test it on a virtual machine and then reset it to a particular state whenever it crashes or want to try something new. When you do this on a physical machine, unexpected crashes can cause issues even after you uninstall the test software. Testing software on a VM is much safer, as the virtual machine is completely isolated from the host operating system. You can also see whether an application you’re developing works well on all operating systems or has bugs in some operating systems but not others.
How Does Virtual Machine Work?
Virtual machines are set up using a hypervisor or similar technology. A hypervisor is a piece of hardware, firmware, or software that creates your virtual machines, allocates resources to them, and then manages them. Simply put, it’s the layer between your physical computer and your virtual machine. Hypervisors and the virtual machines they run are commonly used for data replication, desktop and OS virtualization, server consolidation, and cloud computing.
In an enterprise setting, it’s common to have numerous servers operating different services, and in some cases, you may even be using a range of operating systems in your enterprise. Through a hypervisor, you can manage and virtualize all these different servers, and centrally control them to more efficiently handle this infrastructure. A hypervisor enables you to allocate resources to numerous virtual machines, regardless of which parts of your system the VM is used for or what operating system it runs.
Hypervisors also provide a security layer between your virtual machines and your host machine operating system, preventing faulty applications or corrupted files from infecting your host machine. For example, if you download a corrupted or infected file on your VM, the hypervisor will prevent the file from getting to your host machine. Some malware targets the hypervisor itself, so hypervisors also require security measures to be in place.
There are two main types of hypervisor: native and embedded. Native hypervisors are installed directly on the physical hardware, while embedded hypervisors are installed on the operating system.
- Native (“bare metal”) hypervisor: Bare metal hypervisors are usually more efficient—and faster—than hosted hypervisors. This is because they’re installed directly on the machine, and don’t have an operating system layer between them and the hardware. They also don’t need to compete with an operating system or other applications running simultaneously, which allows them to access all the computing power of the host machine. This extra power can then be allocated to the VMs the hypervisor is managing. In some ways, bare metal hypervisors are also better for security purposes, as there’s less attack surface available for attackers without an operating system.
- Embedded (“hosted”) hypervisor: Hosted hypervisors have the primary benefit of being simpler to set up. You can use them just like any other program on your operating system, and you don’t need to know how your hardware works to install them. In most cases, hosted hypervisors are used for application development or testing.
What Virtual Machine Software Is Available?
When it comes to creating a virtual machine, there are several solutions on the market, with VirtualBox, Hyper-V, and VMware being the most commonly known.
- VirtualBox is a free, open-source native hypervisor able to run on Mac OS X, Linux, Solaris, OpenSolaris, and Windows. It works well on Windows and Linux and is a great starting point if you want to try out VM software but aren’t ready to pay for anything yet. It’s owned by Oracle.
- Hyper-V is the VM offering from Microsoft. This native hypervisor comes pre-installed with Windows 10 Pro, Enterprise, and Education and allows you to virtualize operating systems and hardware components such as hard drives and network switches.
- VMware has a selection of virtualization solutions, depending on if you want to run it on Windows, Linux, or Mac OS X. VMware Workstation—previously called Player Pro—is for Windows and Linux. It’s free for non-commercial use, but the paid version includes additional capabilities. For Mac OS X you can use VMware Fusion, which doesn’t offer a free version.
- Parallels Desktop, like VMware Fusion, allows Mac OS X users to run Windows on their system. These programs are high quality and fulfill a widespread need, as many Mac users also run Windows software.
- KVM is an integrated virtualization solution included with Linux distributions.
Beyond these solutions, other, smaller VM offerings are available for different operating systems. The one you choose will depend on your hardware and OS needs, as well as your enterprise requirements.
How to Set Up a Virtual Machine
Setting up a virtual machine isn’t too tricky, and for most of the VM solutions—assuming you’re using a hosted hypervisor running on the operating system—you can follow the same process.
- Open the VM app and click the button to create a new VM.
- Follow the instruction wizard for VM creation, being sure to change any default values if necessary.
- Ensure the name and version of your VM are correct.
- If you already have a virtual disk you want to use, you can skip any steps asking you to create a virtual database. If you don’t have a virtual disk, create a database through the VM tool. Consider whether you want to create a dynamically allocated disk or a fixed-size one. (In most cases, as we’ll see in the next section, you’ll want to use a fixed disk.)
- Choose the size of your disk.
- Click the “Create” button or its equivalent.
- In the main VM app window, you should be able to see all the VMs you’ve created; select the one you want to run through the application.
Improving Virtual Machine Performance
Once you’ve set up a virtual machine (or several), you may need to optimize performance to make sure everything is working efficiently, or to increase the speed of your network. The following tips will guide you in optimizing your VM performance.
- Use fixed disks. In most cases, you should be using fixed-size disks, which use up less overhead and allow you to undertake better and more accurate capacity planning. If you allocate a fixed disk to each VM, you’ll have a better idea of what kind of resources you have available and what’s already in use. That said, in most cases you won’t notice much difference between fixed and dynamic allocation. However, when you’re scaling up or working with a large enterprise infrastructure, small differences can add up.
Fixed disks also make more sense if you have a limited amount of physical storage. And in production environments, you’ll find dynamic disk allocation slows down performance over time as the VMs use up more space. - Allocate plenty of memory. Most VMs will be memory hungry, so consider allocating more memory than you think they’ll need and allow your VMs to switch off the memory on a usage basis, which helps to maximize efficiencies. In some cases where your VMs are performing poorly, you can allocate more CPU.
- Switch to solid-state drives. Switching to solid-state drives is one of the fastest ways to improve performance. Depending on what processors you have, you can use them for improving virtualization. For example, the Intel VT-x and AMD-V are specialized processors designed with virtual machines in mind. If you have these processors, make sure they’re enabled. If you’re setting up infrastructure and you know you’ll have a heavy load of virtual machines, consider provisioning these processors from the outset.
- Reduce background applications. In many cases, simply reducing background applications and programs—including reducing the frequency of scanning VM directories with antivirus software—can help to improve VM performance and response times. Essentially, treat VMs like physical machines, as many of the same performance concepts apply.
- Monitor your VMs. The importance of monitoring your virtual machines shouldn’t be understated. Before you can accurately allocate resources and determine whether your machines are functioning correctly, you need to have a good understanding of the user experience and how your VMs are performing across your infrastructure.
In some cases, virtual machines used across enterprises are all configured in the same way. However, one person may need more RAM for their applications than another, while someone else might need a VM with different applications installed. Monitoring VM performance and use is an important part of making sure your enterprise VMs are functioning as they should be, and nobody is coming up against unnecessary bottlenecks. Monitoring generally helps you discover areas of improvement, as well as opportunities for automation and real-time resource reallocation.
There are a few measures you should be tracking using VM performance monitoring tools. These include:
- Events, such as crashes, app load delays, and login delays
- RAM
- CPU
- Disk storage
- Network traffic
- User experience
Use a VM performance monitoring tool to collect data and metrics for as much of your network as possible and compare reports each week or each month to ensure the system is functioning well and there are no growing issues. Once you have historic and continuing data collection in place, you’ll be able to monitor trends (such as which VMs are consistently reaching resource limits), more effectively approach capacity planning, and flag any VMs regularly experiencing crashes, delays, or application issues.
Moreover, the data collected through a VM performance tool will make it easier to show your management team how much of your physical resources your VMs are using and what optimization measures you have in place, and to advocate for greater hardware resources if necessary.
Best VM Performance Monitoring Tools
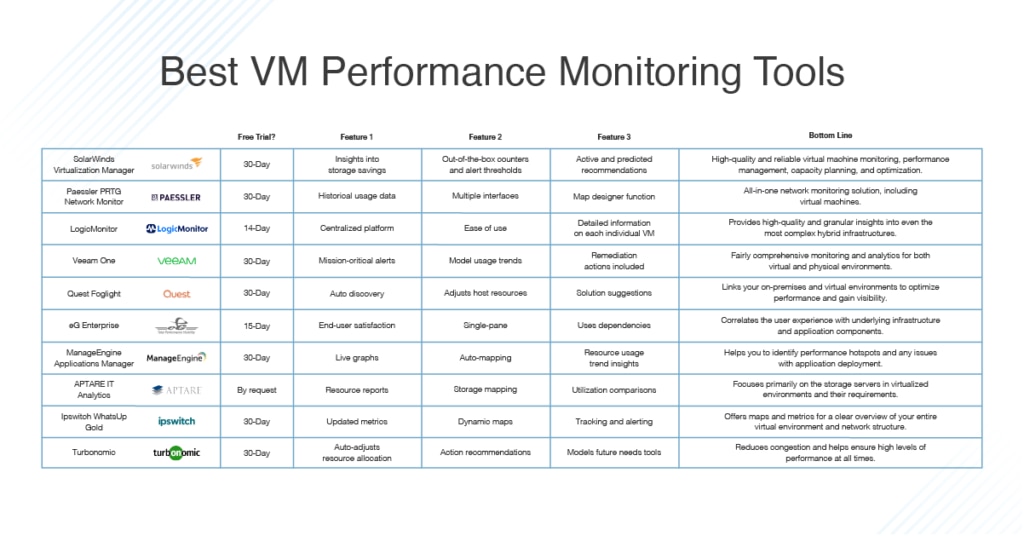
The first tool I’ll discuss is SolarWinds® Virtualization Manager (VMAN). SolarWinds provides tools for monitoring and troubleshooting different parts of your network, including virtual machine performance testing tools. VMAN provides high-quality and reliable virtual machine monitoring, performance management, capacity planning, and optimization. This is my recommended tool, not only due to its comprehensive and broad range of features, but also due to the strength of the brand, service levels, and customer care.
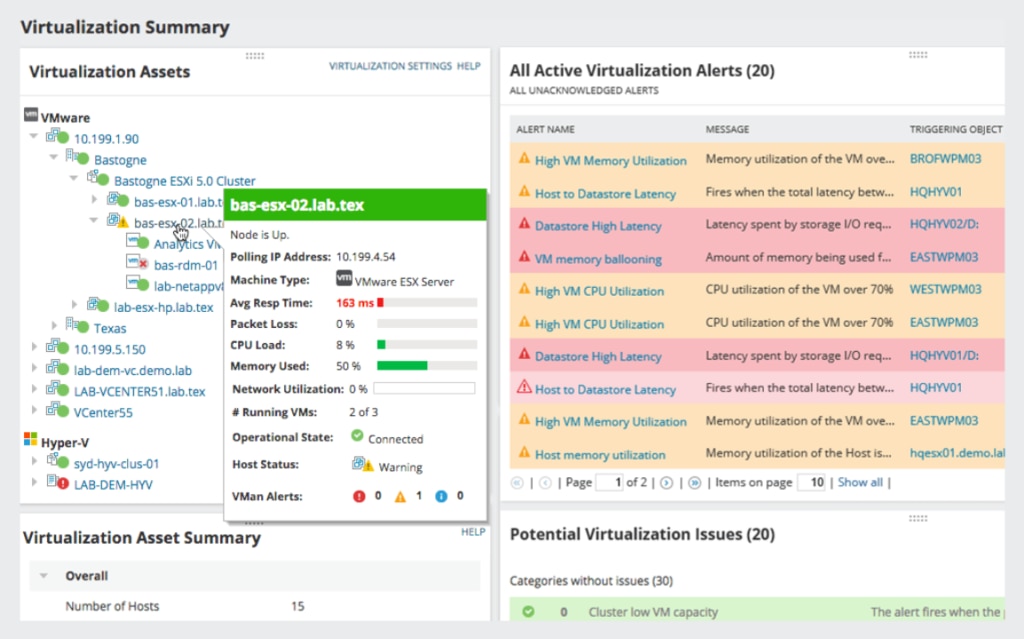
One of the greatest benefits of SolarWinds Virtualization Manager is the ability to gain complete insights into virtual machine performance, capacity, and usage, along with active and predicted recommendations to optimize your VMs. You don’t even need to log in to a hypervisor—this can all be done through VMAN, saving you huge amounts of time and effort. VMAN also helps you control VM sprawl and resource inefficiencies by powering off idle VMs or deleting VMs no longer in use. This can help to reclaim resources the host machine or other VMs can then use.
Capable of both Microsoft Hyper-V and VMware vSphere performance monitoring, VMAN collects data to inform predictions regarding memory needs, storage capacity, and CPU and network performance. With this information, you can create and run models to help you support new workloads or run checks to ensure your hardware resources match your current VM usage. The benefits here are obvious, as you’ll be able to see whether you need to expand your resource scope before you start to see performance issues.
VMAN has a range of features specific to VMware, including out-of-the-box counters and thresholds to trigger alerts, making it one of the best VMware tools on the market. The VMware vSAN Performance Monitor facilitates troubleshooting of vSAN software-defined storage, allowing you to check up on vSAN capacity and performance and make sure free space is available, as well as to conduct health checks such as latency monitoring. In turn, this enables you to more easily forecast capacity.
VMAN also provides insights into storage savings due to deduplication and compression, so you can determine whether there’s scope for further optimization. Optimizing your systems allows you to run a greater number of VMs on the same hardware, resulting in major cost savings to your business. And you’re not even limited to on-premises servers or virtual machines—with VMAN, you can link in with cloud infrastructure including Amazon EC2 instances and Microsoft Azure VMs. These are fully integrated into the monitoring environment, so you can gain an overview of your entire system in one console.
Virtualization Manager includes event monitoring and alerting tools to notify you of performance issues, major errors, capacity problems, and so on as they occur. Alerts and warnings are categorized on the dashboard as either critical, serious, warning, or informational, allowing you to see at a glance which issues warrant your immediate attention and which you can leave until later.
The integrated PerfStack™ feature (also available in other SolarWinds tools) is incredibly useful, as it allows you to drag, drop, and overlay VM management tool performance metrics on one graph. Using PerfStack, you can correlate different data types and information on a single chart, facilitating more streamlined troubleshooting and making it possible to easily see whether a problem is having flow-on effects for your network.
You can try out the fully functional Virtualization Manager free of charge for 30 days, and then ask for a quote for your business. SolarWinds also offers free software called VM Monitor, a more limited tool focused on CPU and memory usage. Unlike VMAN, which has Amazon EC2 and Azure capabilities, VM Monitor is exclusively a Hyper-V and VMware monitoring tool and can only be used to monitor a single server. However, its quality is as high as any SolarWinds offering, and it may suit the needs of small businesses.
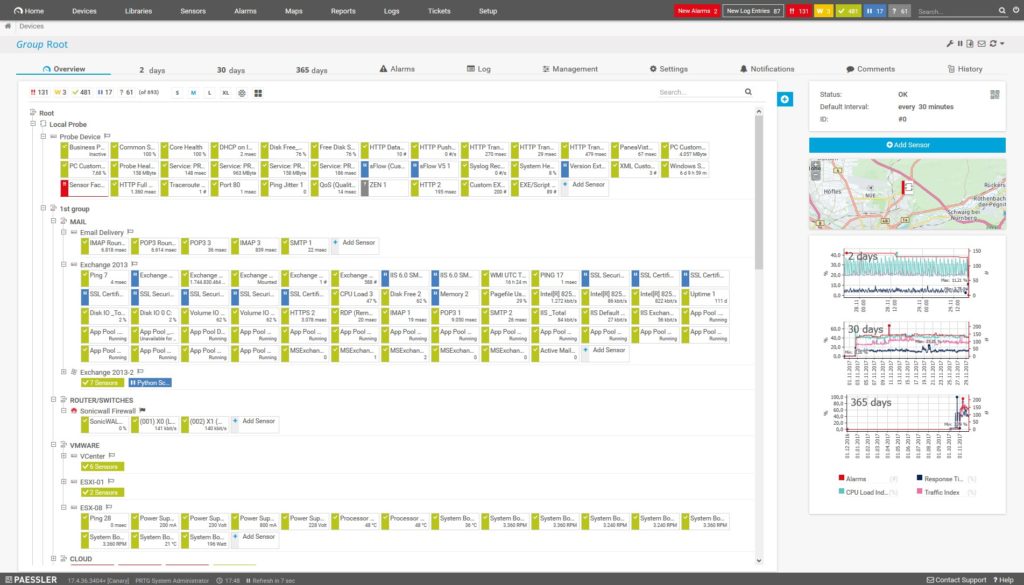
Paessler PRTG Network Monitor is an all-in-one network monitoring solution, meaning it monitors the entire network, including virtual machines. You might find this helpful in creating and monitoring your VMs. For example, before starting a virtual project or creating sets of virtual machines, you need to be aware of the CPU and memory load you have available, as well as how much disk space you have. PRTG provides this information and guides you in figuring out the requirements of the applications you’ll run on the VM.
Once the virtual machine is running, you need to monitor its performance. PRTG shows you historical usage data to examine the current and expected resource load on each network connection or host server and sets thresholds for alerts if loads are going to exceed their recommendations.
Returning to the more generalized rather than VM-specific monitoring tools, PRTG offers multiple interfaces (desktop, web app, mobile app) through which to view your overall network performance, with a range of visualizations and graphs available. And using the tool’s map designer, you can create maps of your entire network.
As a virtual machine performance monitoring tool, PRTG has some functionality, but it’s better suited to enterprises without a large virtual machine load. It would be better used in an enterprise setting for general network monitoring, with the virtual machine component a bonus rather than the key focus of this tool.
You can try PRTG Network Monitor for free for 30 days with no limitations. Once the trial ends, if you want to continue to use the free version, you’ll be limited to 100 sensors.
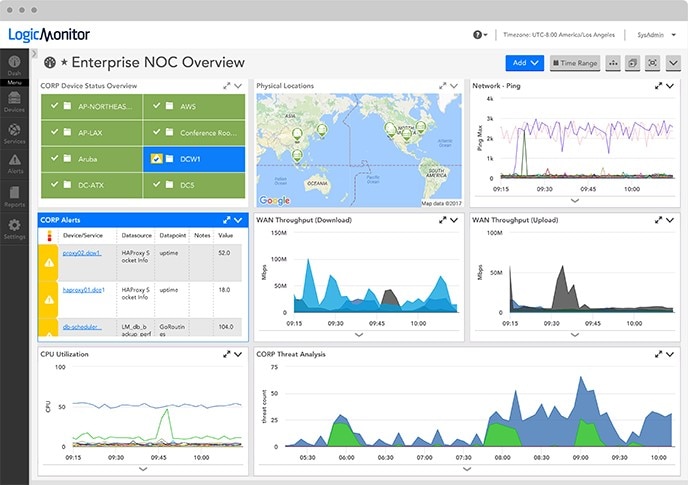
LogicMonitor is a comprehensive network and infrastructure monitoring software designed to provide high-quality and granular insights into even the most complex hybrid infrastructures. It uses more than 1,000 monitoring templates to work with a wide range of platforms and tools, including VM software such as VMWare. These templates provide the foundation of LogicMonitor software’s capabilities for infrastructure and network discovery, performance monitoring, and alerting. LogicMonitor also allows you to examine your cloud performance alongside your on-premises infrastructure, with cloud availability, ROI, and performance metrics provided in the same centralized platform.
When it comes to network performance, LogicMonitor collects NetFlow, J-Flow, sFlow, and IPFIX data, and monitors all your routers, switches, firewalls, servers, storage, and applications, including VMs. You can see exactly where network traffic is originating from, quickly resolve bottlenecks, and examine all network data in easy-to-understand reports with pie charts and graphs.
LogicMonitor stands out among VMware VM monitoring tools for its ease of use. All you need to do is provide your vCenter or vSphere hostname, and LogicMonitor will begin to automatically discover and map your entire virtual ecosystem. It can gather information on your virtual machine CPU usage, latency, IOPS, throughput, health status, and more. It also examines hypervisor performance, including CPU utilization, memory use, throughput, and so on, and monitors and analyzes datastores, networks and interfaces, resource pools, and hardware health. It also provides detailed information on each individual VM. This overview of your entire VM environment provides valuable information you can use to more easily troubleshoot and conduct capacity planning.
You can sign up for a 14-day free trial of LogicMonitor or pay on a per-device basis. It’s also available for purchase as a software-as-a-service product.
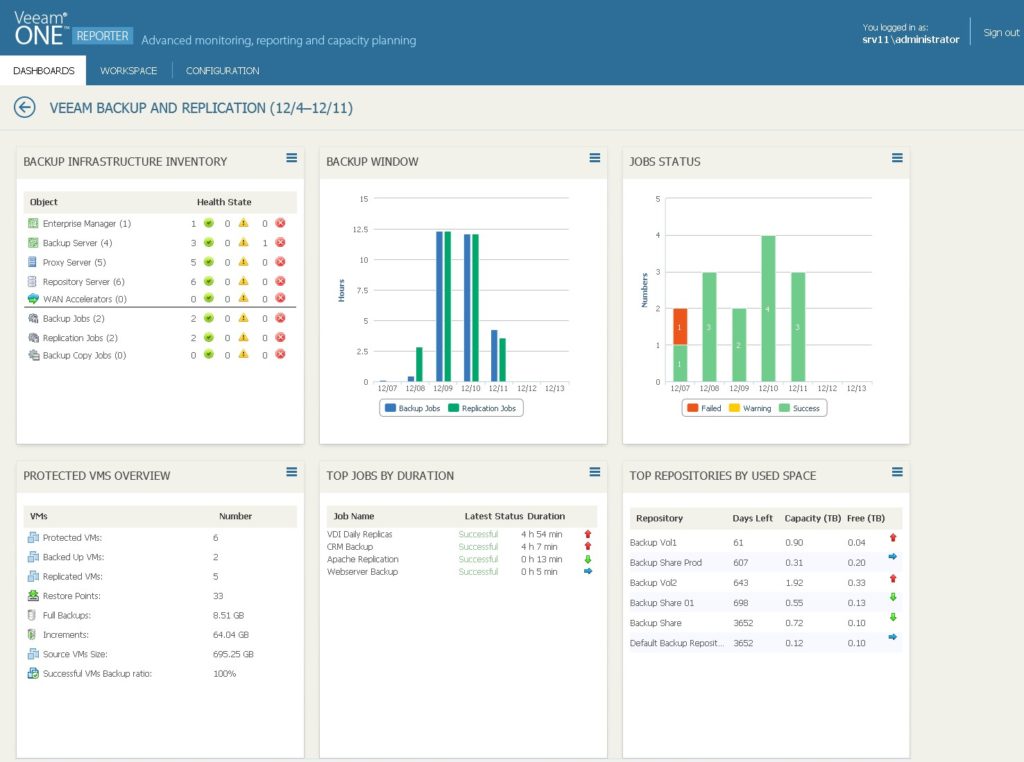
Veeam One provides comprehensive monitoring and analytics for both virtual and physical environments. It offers support for Veeam agents, VMware vSphere, and Microsoft Hyper-V. In addition to providing 24/7 real-time monitoring, reporting, and alerting for virtual environments, it allows you to set alerts specifically for mission-critical applications running on VMs.
Veeam One provides historical data to forecast resource usage and plan for capacity changes, and it includes the ability to model usage trends and predict costs for storage, compute power, and backup. It uses built-in intelligence to troubleshoot common or frequent infrastructure issues and software misconfigurations, including intelligent “Remediation Actions”—self-healing processes and controlled responses to alarms designed to help you quickly resolve issues. These actions are based on common issues and pre-established policies, removing the amount of effort you have to manually put in to troubleshoot common problems.
In addition to real-time dashboards to show you how your entire network and virtual environments are performing, Veeam One comes with an interesting heatmap feature designed to pinpoint overutilization and possible infrastructure weaknesses or vulnerabilities. It shows your different repositories and color-codes them in green, yellow, or red, depending on their utilization levels. This way, you can quickly identify and prioritize issues. It generates high-quality reports on infrastructure, performance, and configuration, allowing you to see whether you’re meeting best practices for VM configuration, processing, storage, and backup (and whether backups are running as planned). It also includes reporting for compliance purposes.
Pricing is on a per-year subscription basis, per 10 instances. You can download a 30-day free trial, from which you can upgrade to the paid subscription. For small businesses limited to three or fewer proxy servers and three or more repositories, Veeam One also offers a free Community Edition.
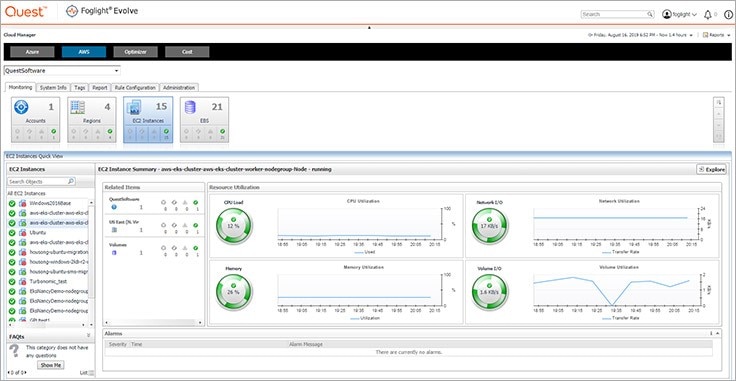
Quest Software produces a broad range of products for database and infrastructure management and is well known for its database management software Toad. It also has a tool called Foglight, a monitoring and diagnostic program for applications and websites with a focus on user management and server monitoring.
Quest Foglight provides automation and monitoring for VMware and Hyper-V, as well as performance monitoring for databases and virtual environments in general. It has high-performing integrated modules linked with your on-premises and virtual environments to optimize performance and gain end-to-everything visibility across your infrastructure. It also works with Azure and AWS to automate, optimize, monitor, and forecast virtualization storage capacity, helping you save money and ensure limited downtime for all your services, and can suggest ways to resolve your network or infrastructure issues.
An auto-discovery feature discovers and maps your network, then analyzes the traffic passing through your network using packet-level data to identify high-traffic-generating VMs and applications. The management functions are also useful: Foglight can dynamically adjust your host resources to fit the needs of each VM or application, and it accounts easily for over- or under-utilization.
Quest Foglight is a paid solution but offers a free trial. It runs on Windows, Linux, and Solaris.
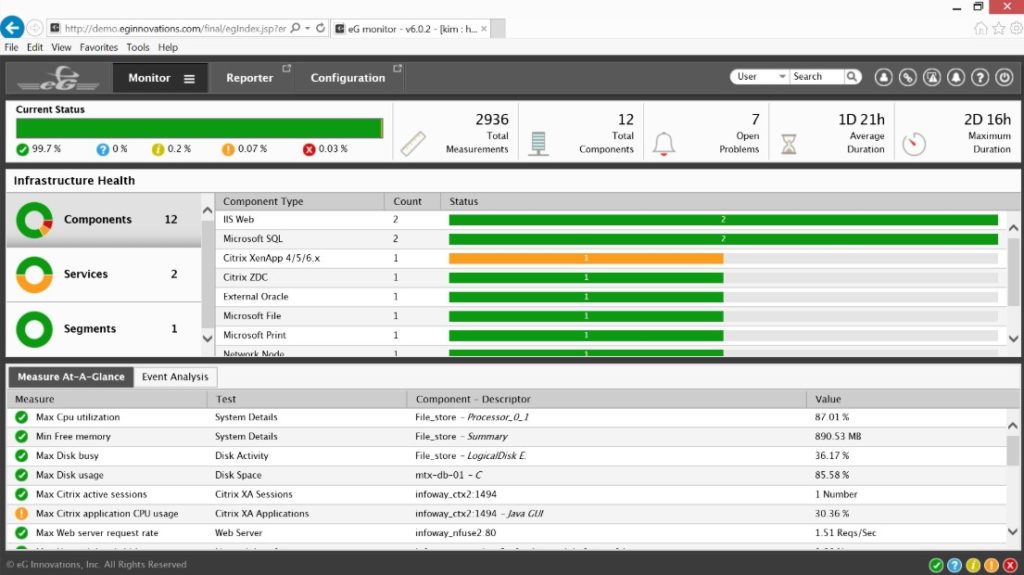
The eG Enterprise is made by eG Innovations, which has been around since the early 2000s. The company has a long-term partnership with Citrix and specializes in working with Citrix technologies.
The eG Enterprise tool provides end-to-end application and network performance visibility and correlates the user experience with underlying infrastructure and application components to quickly pinpoint performance slowdowns. The single-pane interface allows you to easily see how your infrastructure is functioning and where any problems have arisen. This includes performance insights from virtual servers, networks, storage, user experience, and applications.
The tool focuses on end-user satisfaction and productivity as the measures of application performance. Through what eG Innovations refers to as “real user monitoring,” it looks not just at IT resources such as CPU, memory, and disk space, but also which transactions are slow and where. However, it requires real users to be affected before problems can be discovered and solved, a “bottom of the cliff” approach rather than a preventive one.
For virtual machines, eG Enterprise provides “inside-outside monitoring,” which looks at both hypervisor and virtual machine performance. It provides “single-click diagnosis” as well as comprehensive reporting for use in optimization, rightsizing, and capacity planning. When prioritizing alerts, it accounts for inter-application, application to VM, and VM to physical machine dependencies. This way, it can determine which alerts are likely to be high priority, so performance issues can be quickly resolved.
eG Enterprise covers many virtualization platforms, including VMware vSphere, Microsoft Hyper-V, Oracle VM Server, Red Hat Enterprise Virtualization, and Solaris Containers. It’s available as either a subscription, license, or SaaS offering, and offers a free trial as well as a demo.
ManageEngine makes performance monitoring and IT management software, primarily for small and medium-size businesses. Their Applications Manager provides server and application performance monitoring, including for infrastructure components such as VMs. It includes end-to-end monitoring of virtualized environments and supports technologies including VMware, Microsoft Hyper-V, Citrix Hypervisor and Virtual Apps, Amazon EC2 and Amazon RDS, and Kubernetes.
Applications Manager provides insights into your virtualized environments, including resource utilization, so you can undertake effective capacity planning. It helps you identify performance hotspots and any issues with application deployment, as well as general IT environment health, performance, and resource usage trends. Reporting includes live graphs with performance data, and the system will set itself up automatically to map your network and determine dependencies.
The company’s other main product, OpManager, also provides visualization and monitoring tools, and has the capacity to monitor VMware ESX servers, Citrix XenServer, and Microsoft Hyper-V environments. The greater range of Applications Manager makes it the primary VM monitoring tool from ManageEngine, but the split between the two tools means complete VM monitoring may require both. The good news is they integrate seamlessly and can share data without problems.
Both OpManager and Applications Manager run on Linux and Windows. You can try out a demo of the Applications Manager or get a quote for a subscription or a perpetual license. If you’re looking at both OpManager and Applications Manager when considering VM performance monitoring, Applications Manager is the better choice due to its greater support of VM tools.
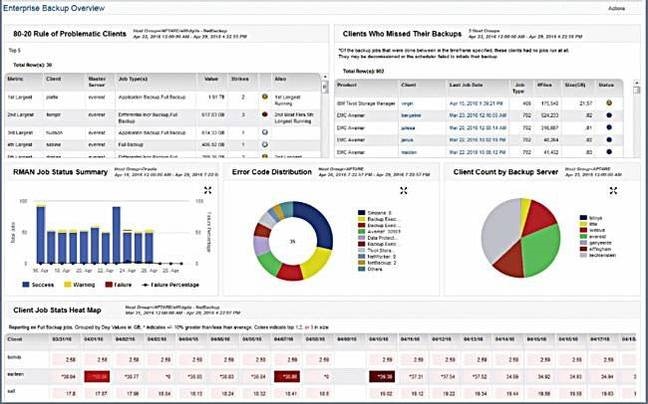
APTARE IT Analytics platform includes a tool called Virtualization Manager, which is slightly different from some of the others on this list because it focuses primarily on the storage servers in virtualized environments and their requirements. The aim is to optimize storage environments and improve performance, thereby reducing capital expenditures. The tool provides reports and information on resource consumption so you can reclaim unused storage, improve resource utilization, and cut down on unnecessary consumption.
APTARE shows you your complete virtual environment, including capacity. It helps you make informed decisions as to how to deploy your applications in virtual environments, and what resources to allocate. You can map the storage used by each of your VMs, all the way down to your storage arrays, and view which of your machines are over- or under-utilizing the storage they have available. In addition, you can view resource utilization at both the logical disk and virtual disk levels, and the tool’s predictive analysis feature allows you to forecast future storage capacity and get a clear picture of how your storage views are growing or shrinking.
APTARE includes runtime statistics for each virtual machine and can look at your runtime and storage utilization to provide chargeback reports based on user-defined pricing. It offers support for technologies including Veeam, Rubrik, ECS, Hyper-V, and Oracle RMAN. Although it’s more limited than some of the other tools I’ve discussed, it can provide useful information if you want to look at the particulars of your virtual storage environments.
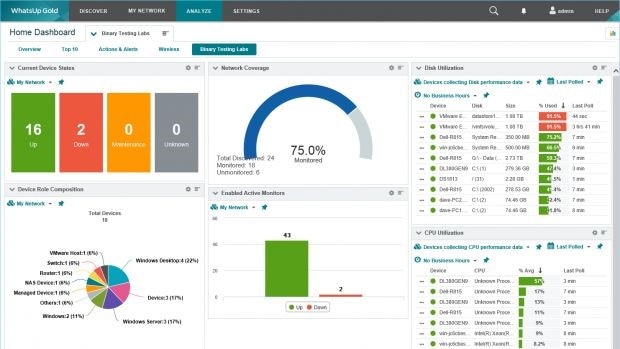
Ipswitch WhatsUp Gold network monitoring software comes in three versions: Premium, Total Plus, and Distributed. The Premium version monitors network devices and servers in the cloud or on-premises; Total Plus is used for those as well as for applications; and Distributed is designed for the management and monitoring of remote sites and distributed networks. Virtualization Monitoring is a feature built in to Total Plus, and for the other versions it’s available as an add-on.
WhatsUp Gold Virtualization Monitoring includes monitoring and performance tools for your workloads, applications, and physical and virtual servers, along with mapping for your VMware and Hyper-V environments. It displays all these metrics in a unified dashboard, giving you a clear overview of your entire virtual environment and network structure. You can also use it to track VM migrations as well as to understand and troubleshoot any physical-to-virtual relationships.
The reporting tools included in WhatsUp Gold provide a continually updated performance picture, with information including virtual hosts and their attributes; virtual servers and their attributes; and virtual machine CPU, memory, and disk utilization. You can integrate these reports into end-to-end dashboards to visualize the entire IT infrastructure. Dynamic maps of your infrastructure show you hosts and guests, host-guest relationships, clusters, and real-time status, and you can click on each of these elements to get more detailed performance and health data.
WhatsUp Gold keeps an up-to-date list of all hosts and attributes, so you can keep track of how your infrastructure is developing and know when changes are made. It generates alerts based on predefined threshold settings. Tracking and alerting are automatically set at one-minute polling intervals but can be customized to fit your needs.
Pricing for WhatsUp Gold depends on which version of the base software you buy; for the Premium and Distributed versions, the Virtualization Monitoring add-on is priced separately. Pricing is calculated on a per-device basis and length of subscription and service agreement. You can also look at point-based pricing or bundle together several other add-ons when you buy.
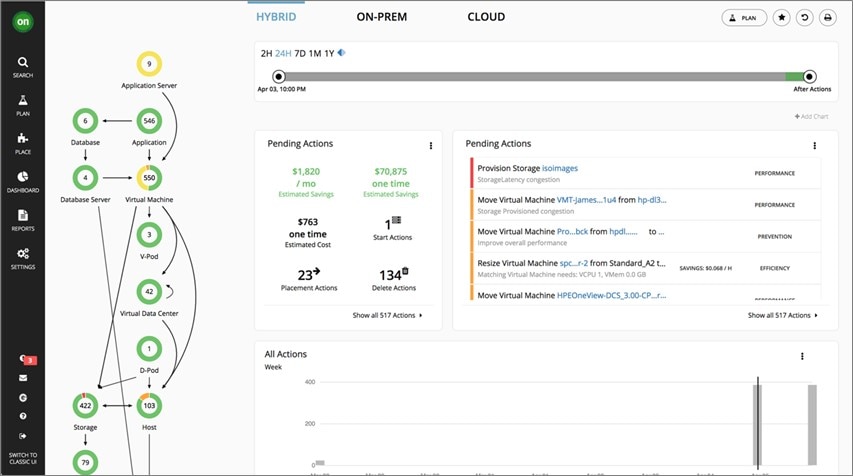
Turbonomic is an application resource management tool that aims to optimize performance, compliance, and cost. It monitors the entire application stack, including virtual components, to reduce congestion and ensure high levels of performance at all times. It’s advertised as a tool to monitor hybrid and cloud infrastructures, but it also has a solid approach to VM monitoring.
It can automatically adjust to reallocate resources where necessary and integrates well with existing infrastructures. It supports VMware, Microsoft Hyper-V, Red Hat Virtualization Manager, Citrix XenServer, and IBM PowerVM, and includes appealing visualizations for viewing performance and reporting metrics. Its notable features include the ability to set up alerts to include automatic resolutions, so when a specific alert occurs, Turbonomic will automatically take your chosen steps to resolve it. It also includes action recommendations when your VM setup is having performance issues.
In addition, like SolarWinds Virtualization Manager, Turbonomic can model the real-time and future scaling needs of vSAN environments, which helps you ensure application performance and undertake strong capacity planning.
Turbonomic comes in three versions: Essentials, Advanced, and Premier. Each version is priced depending on the number of virtual machines you want to support. In contrast to Essentials and Advanced, the Premier version can integrate with database servers, optimize container environments, and place workloads across the network in an intelligent way. There’s no free version available, but you can download a 30-day free trial of the Premier edition. If you decide to purchase any of the versions, you can do so on a per-workload basis.
The Takeaway on Best VM Monitor
Virtual machines are becoming a vital part of both on-premises and cloud computing, joining physical devices in making up the enterprise infrastructure. They enable organizations to more safely and effectively develop and test applications, enhance their storage, duplicate workspaces, and achieve flexibility in the use of operating systems.
VMs require a different set of knowledge and tools than physical machines, and the appropriate performance monitoring solution will go a long way toward ensuring your network and virtual machine setups run efficiently and without problems. I highly recommend SolarWinds Virtualization Manager for enterprises—it’s made by a reliable and reputable player on the application monitoring market, and it comes with a broad suite of tools to cover all of your VM performance monitoring needs.